- USD/JPY recovery extends into the Asian session.
- The level to beat for buyers is the 109.92 resistance.
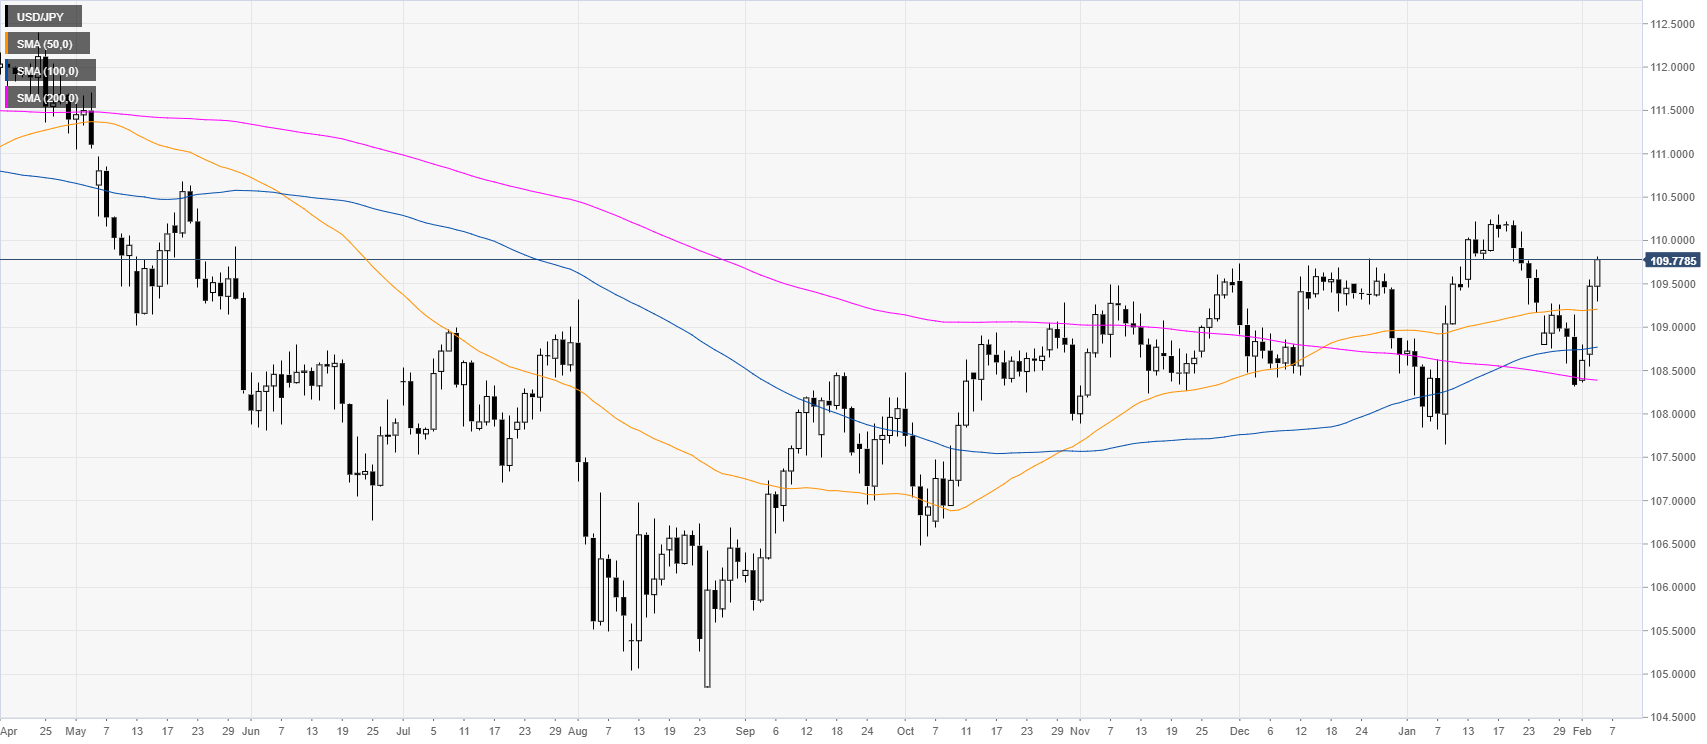
USD/JPY daily chart
USD/JPY jumped above the main simple moving averages (SMAs) as the market entered a risk-on mood.
USD/JPY four-hour chart
As the spot is spiking up, the run could extend on a break beyond the 109.92 resistance towards the 110.30/49 price zone. Pullbacks down could find support near the 109.65, 109.46 and 109.30 levels, according to the Technical Confluences Indicator.
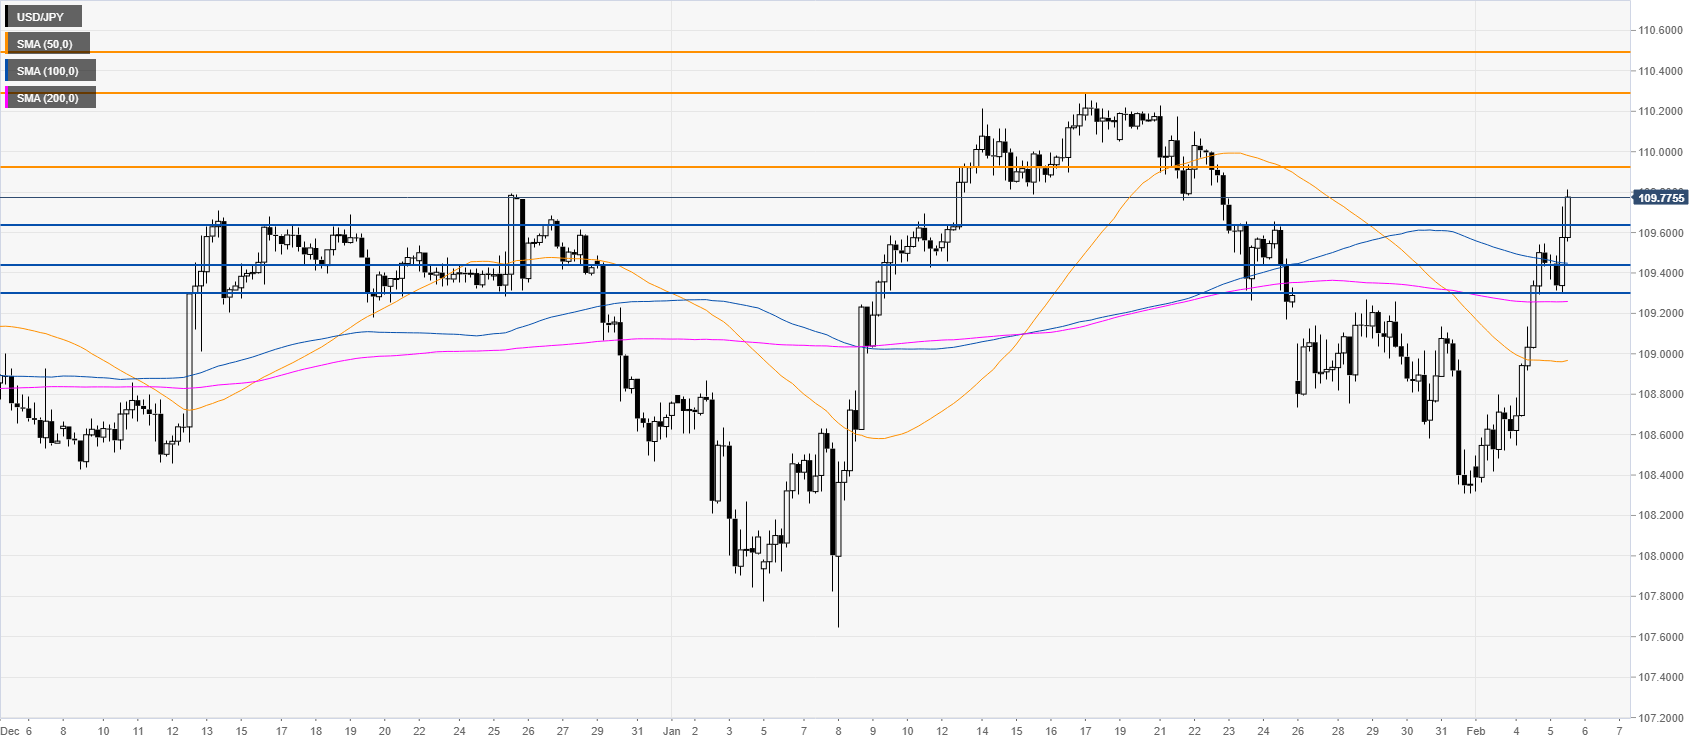
Resistance: 109.92, 110.30, 110.49
Support: 109.65, 109.46, 109.30
Additional key levels
