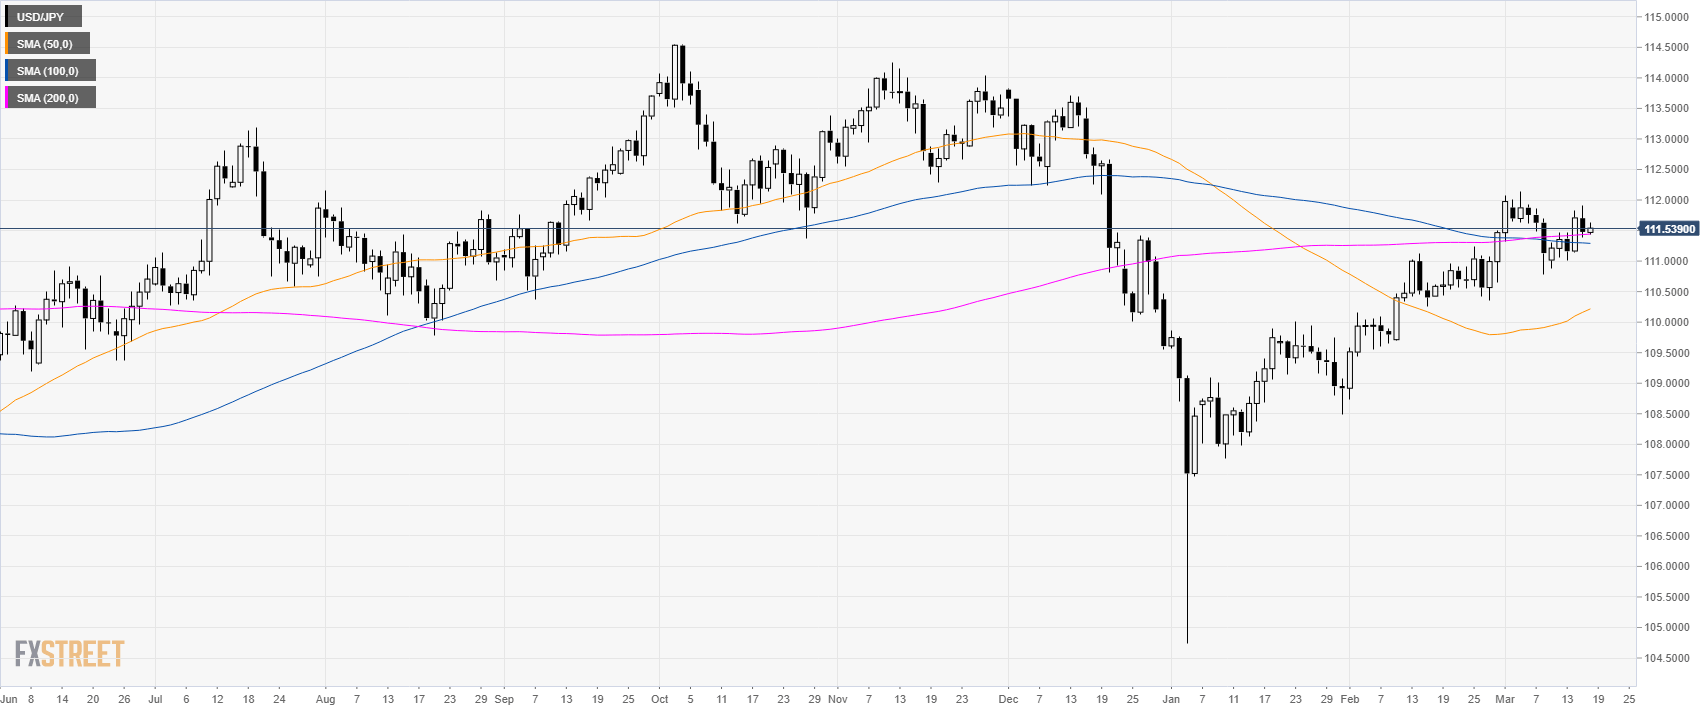
USD/JPY daily chart
- USD/JPY is trading above its main simple moving averages (SMAs) suggesting a bullish bias.
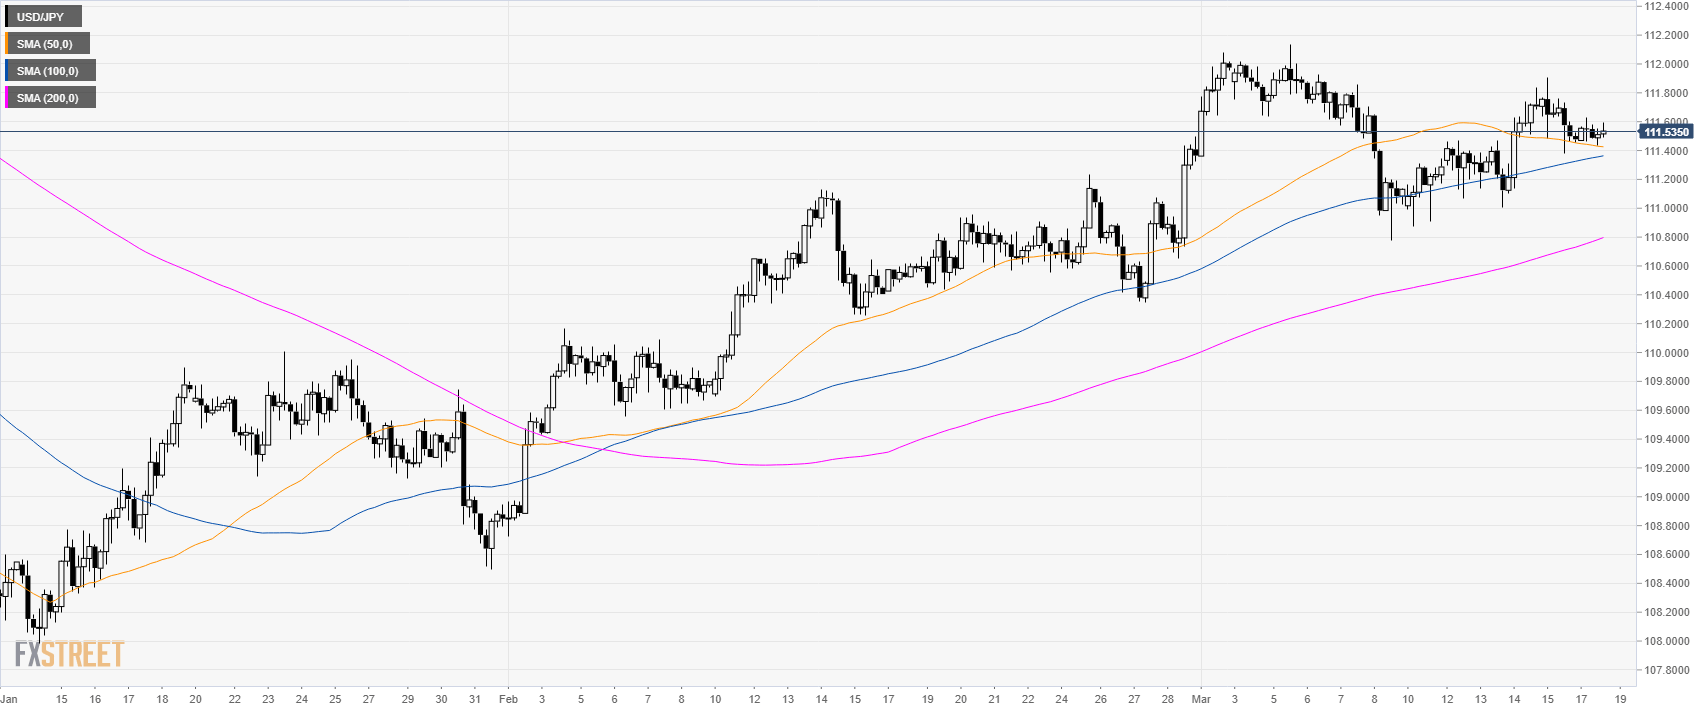
USD/JPY 4-hour chart
- USD/JPY is trading above its main SMAs suggesting bullish momentum in the medium-term.
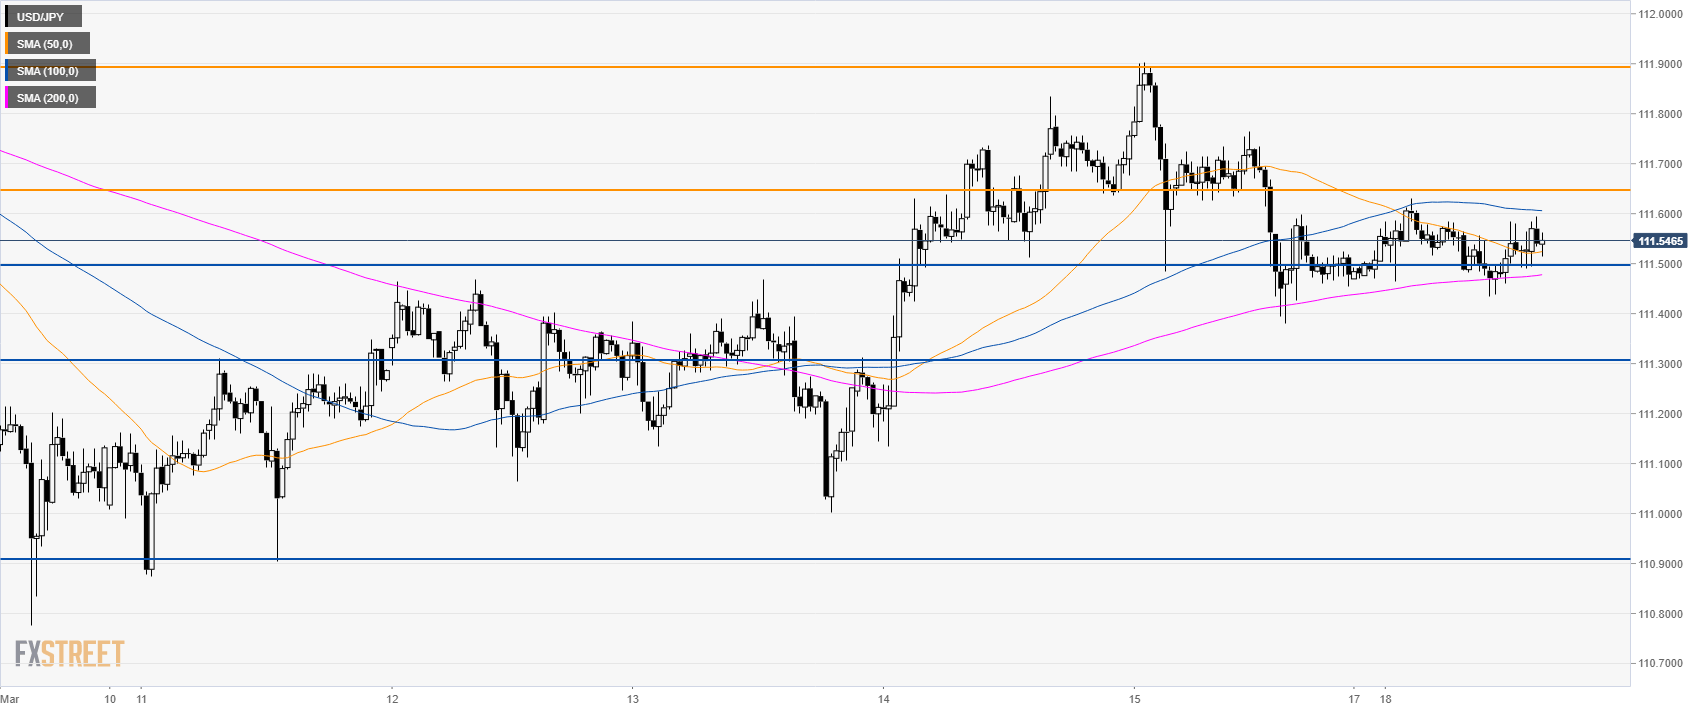
USD/JPY 30-minute chart
- USD/JPY is trading below the 100 SMA suggesting weakness.
- A break below 111.50 can lead to 113.30 key support followed by 110.90 level.
- Key resistance is at 111.65 followed by 111.90 level.
Additional key levels
USD/JPY
Overview:
Today Last Price: 111.55
Today Daily change: 7 pips
Today Daily change %: 0.06%
Today Daily Open: 111.48
Trends:
Daily SMA20: 111.22
Daily SMA50: 110.16
Daily SMA100: 111.3
Daily SMA200: 111.44
Levels:
Previous Daily High: 111.9
Previous Daily Low: 111.38
Previous Weekly High: 111.9
Previous Weekly Low: 110.88
Previous Monthly High: 111.5
Previous Monthly Low: 108.73
Daily Fibonacci 38.2%: 111.58
Daily Fibonacci 61.8%: 111.7
Daily Pivot Point S1: 111.27
Daily Pivot Point S2: 111.06
Daily Pivot Point S3: 110.75
Daily Pivot Point R1: 111.79
Daily Pivot Point R2: 112.11
Daily Pivot Point R3: 112.32
