- The USD/JPY pair developed a continuation pattern, a valid breakout could bring new long opportunities.
- A new lower low could activate a larger downside movement.
- The pair stands above a demand area, a bullish pattern could announce a new swing higher.
The USD/JPY forecast sees the pair move into a corrective phase after registering strong upwards movement. Forex day traders were probably expecting a temporary decline was expected and natural. If you are looking for day trading brokers, check out our guide. In the short term, the rate reached a strong support level, so it could start increasing again. Still, we’ll have to wait for confirmation as the pressure remains high.
From the technical point of view, the USD/JPY pair has printed a continuation pattern, but this is far from being confirmed. The pair is trading in the green at 113.73 at the time of writing as the Dollar Index has registered an impressive rally.
3 Free Forex Every Week – Full Technical Analysis
DXY’s further growth helps the USD to appreciate versus its rivals. Also, the Japanese stock index, the Nikkei, has started to grow after failing to make a new lower low.
The USD started to increase again after Powell’s remarks at an online conference hosted by the South African Reserve Bank on Friday.
Also on Friday, the US Flash Services PMI was reported at 58.2 points versus 55.3 expected and compared to 54.9 in the previous reporting period signalling further expansion. The Flash Manufacturing PMI dropped from 60.7 to 59.2 points below 60.5 expected announcing a slowdown in expansion.
Tomorrow, the BOJ Core CPI and the US CB Consumer Confidence could have a big impact on the USD/JPY pair.
USD/JPY Forecast: Price Technical Analysis – Flag Formation
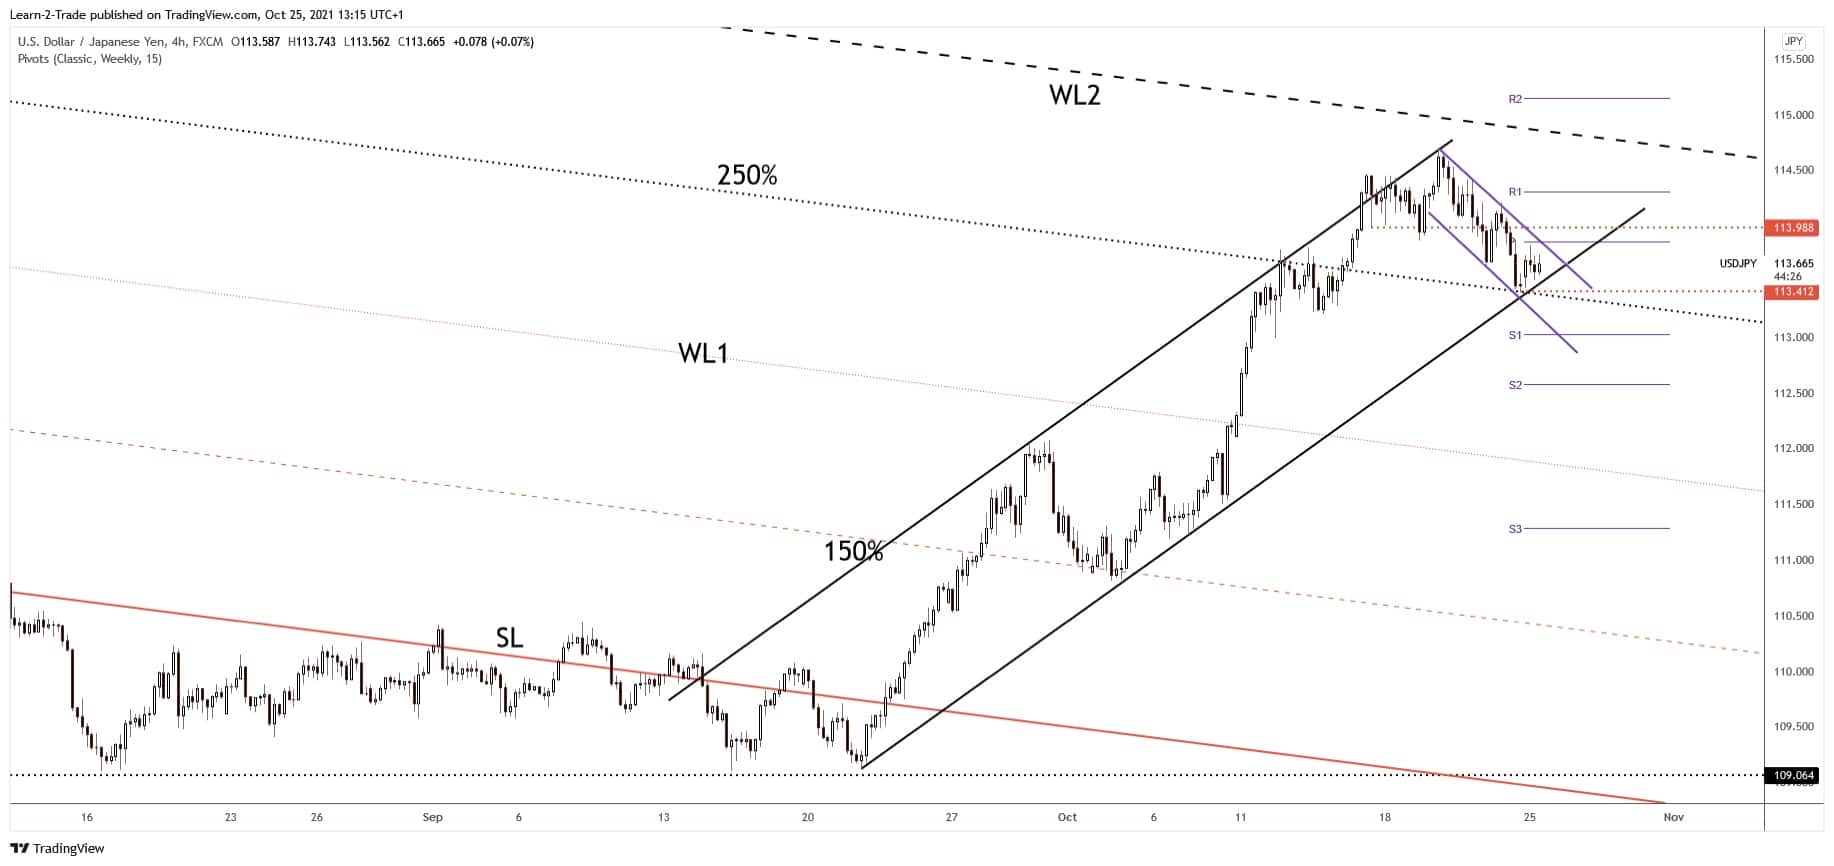
The USD/JPY dropped after retesting the ascending channel’s upside line and now it’s located right above the uptrend line. It has dropped within a flag pattern, within a minor down channel. An upside breakout from this pattern could announce a potential new leg higher.
Technically, the pair could resume its upwards movement as long as it stays above the uptrend line. In the short term, the confluence area formed at the intersection between the weekly pivot 113.86 with the minor downtrend line has stopped the bullish momentum. A valid breakdown below the uptrend line, a new lower low, dropping and closing below 113.41 may activate a larger downside movement.
On the other hand, jumping and stabilizing above 113.98 could signal a strong growth towards the second warning line (WL2).
Looking to trade forex now? Invest at eToro!
68% of retail investor accounts lose money when trading CFDs with this provider. You should consider whether you can afford to take the high risk of losing your money.
