USD/JPY has risen as the US and China reached a trade truce. Can it continue higher? The technical levels show that the path of least resistance is to the upside.
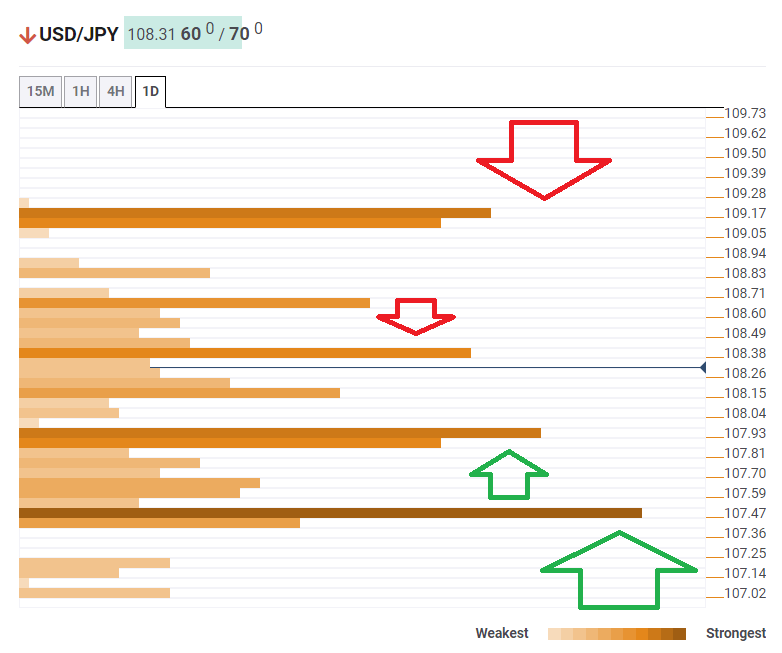
The Technical Confluences Indicator is showing that USD/JPY has significant support at 107.93, which is the convergence of the Fibonacci 38.2% one-week, the Simple Moving Average 100-1h, the SMA 5-one-day, and the Fibonacci 23.6% one-month.
Even stronger support awaits at 107.47, which is the confluence of the Bollinger Band 4h-Lower, the Fibonacci 38.2% one-month, the SMA 200-4h, the SMA 200-1h, and the SMA 50-4h.
Looking up, resistance is considerably weaker. At 108.38, there is a dense cluster of lines, but they are not as significant as the ones composing the support lines. This cluster includes the Fibonacci 38.2% one-day, the Bollinger Band 1h-Middle, the SMA 5-1h, the SMA 5-4h, the SMA 10-4h, the SMA 50-15m, and the SMA 10-1h.
The upside target is 109.17, which is the meeting point of the Pivot Point one-month Resistance 1, the PP 1w-R1, the SMA 200-daily, and the PP 1d-R3.
Here is how it looks on the tool:
Confluence Detector
The Confluence Detector finds exciting opportunities using Technical Confluences. The TC is a tool to locate and point out those price levels where there is a congestion of indicators, moving averages, Fibonacci levels, Pivot Points, etc. Knowing where these congestion points are located is very useful for the trader, and can be used as a basis for different strategies.
This tool assigns a certain amount of “weight” to each indicator, and this “weight” can influence adjacents price levels. These weightings mean that one price level without any indicator or moving average but under the influence of two “strongly weighted” levels accumulate more resistance than their neighbors. In these cases, the tool signals resistance in apparently empty areas.
Learn more about Technical Confluence
