- The USD/JPY pair is traded near the resistance area. A valid breakout could activate further growth.
- Downbeat Japanese data weighed on the Yen.
- Escaping from the triangle and range patterns could bring long opportunities.
The USD/JPY price extends its sideways movement after failing to make a new lower low. The pair is trading at 115.67 at the time of writing. The price rallied as the USD got strength by the DXY’s upside continuation while the Yen was weakened by the weak Japanese Yen Futures. The currency pair could continue to move sideways in the short term before deciding a clear direction. Technically, the price is trading right below strong obstacles. Therefore, only a valid breakout will suggest potential further growth.
–Are you interested in learning more about copy trading platforms? Check our detailed guide-
Fundamentally, the Japanese Yen was weakened by some of today’s Japanese economic data. For example, the Current Account dropped from 0.81T to 0.19T, far below 0.33T, Bank Lending rose by 0.4% less versus 0.6% expected, Leading Indicators came in at 103.7%, matching expectations.
At the same time, the Economy Watchers Sentiment was reported at 37.7 points below 38.1% expected. The only support was from the Average Cash Earnings, which registered a 0.9% growth versus 0.2% expected after a 0.4% drop in the previous reporting period.
Later, the US Trade Balance could drop from -80.7B to -87.5B, while Final Wholesale Inventories may report a 0.8% growth.
USD/JPY price technical analysis: Swing higher
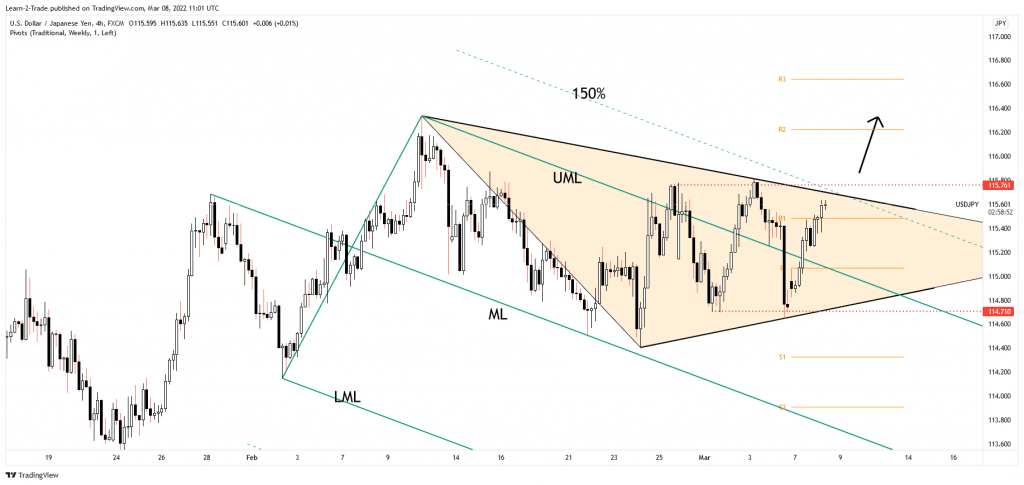
The USD/JPY pair rallied and almost reached the downtrend line, the triangle’s resistance, and the descending pitchfork’s 150% Fibonacci line. As you can see on the H4 chart, the rate moves sideways between 114.71 and 115.76. False breakouts above the near-term resistance levels or a bearish pattern could announce a potential sell-off.
–Are you interested in learning more about scalping forex brokers? Check our detailed guide-
On the contrary, a valid breakout above the downtrend line, from the triangle, and above 115.76 may activate further growth. This scenario could help the buyers to catch a new buying opportunity. Still, a temporary retreat could be natural after the current strong rally. A short opportunity could be announced by a strong bearish pattern, a false breakout with a retest, or a bearish engulfing.
Looking to trade forex now? Invest at eToro!
68% of retail investor accounts lose money when trading CFDs with this provider. You should consider whether you can afford to take the high risk of losing your money
