- USD/JPY bears stepping in at monthly resistance.
- Focus is the downside and the 4-hour structure.
USD/JPY is reaching into supply territory which leaves the focus on the downside. The following is a top-down analysis that illustrates where the next downside opportunity could arise.
Monthly chart
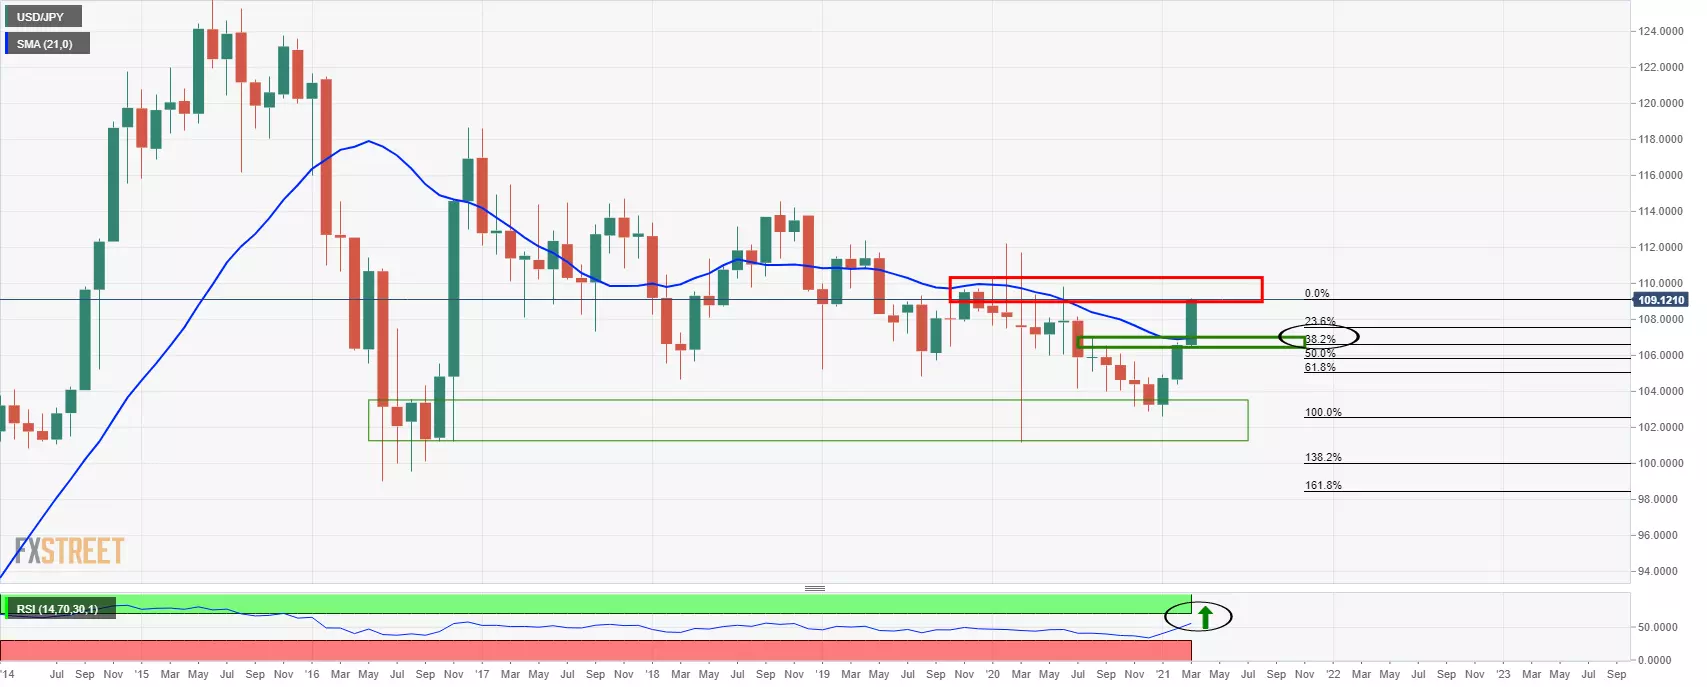
The price is reaching to higher highs and may have some way to go until bears will step in at overbought conditions according to RSI.
Weekly chart
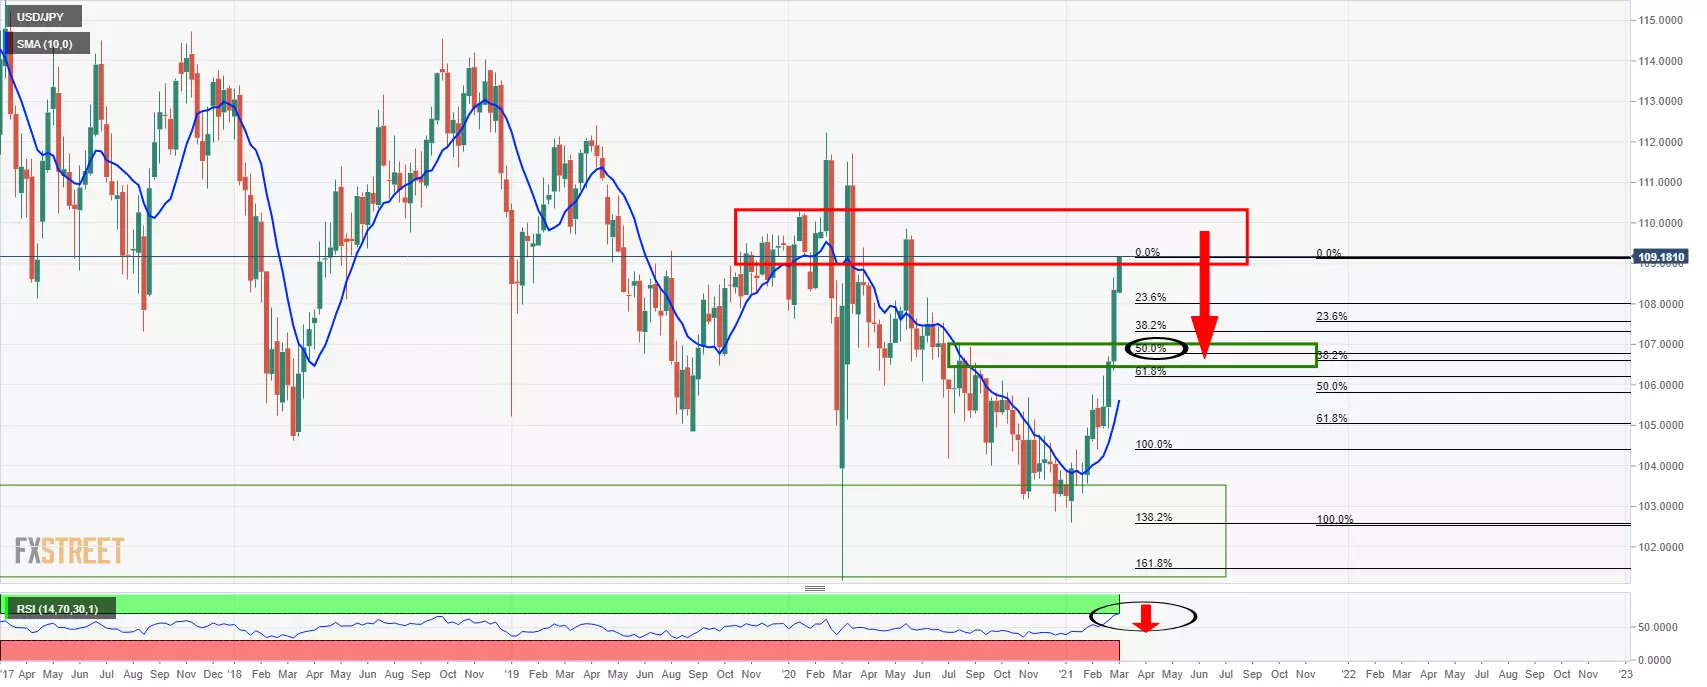
That being said, the weekly chart is already overbought and the Fibonaccis have a confluence between the monthly 38.2% and weekly 50% areas.
Daily chart
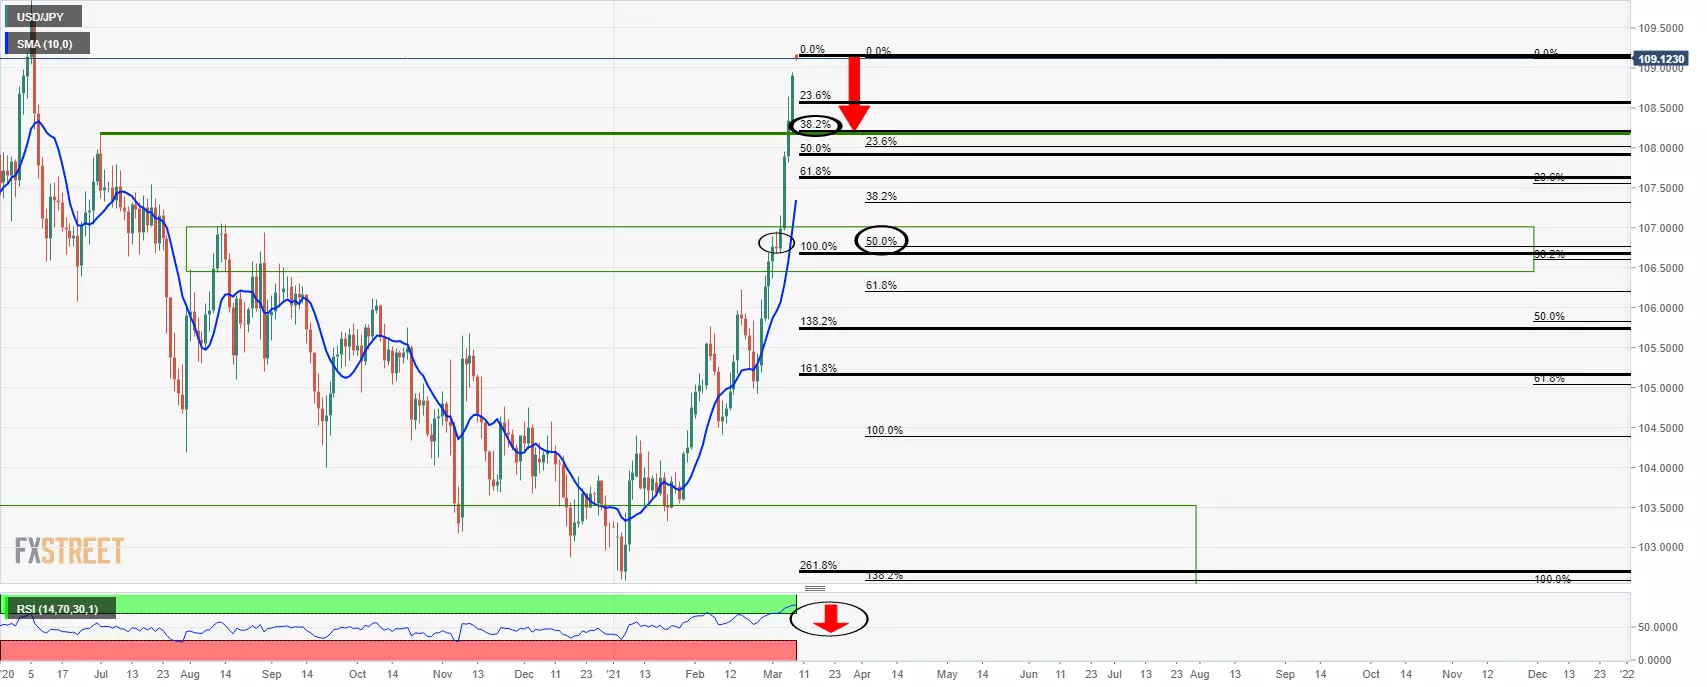
The daily chart is eyeing a 38.2% Fibo with prior resistance to the left.
4-hour chart
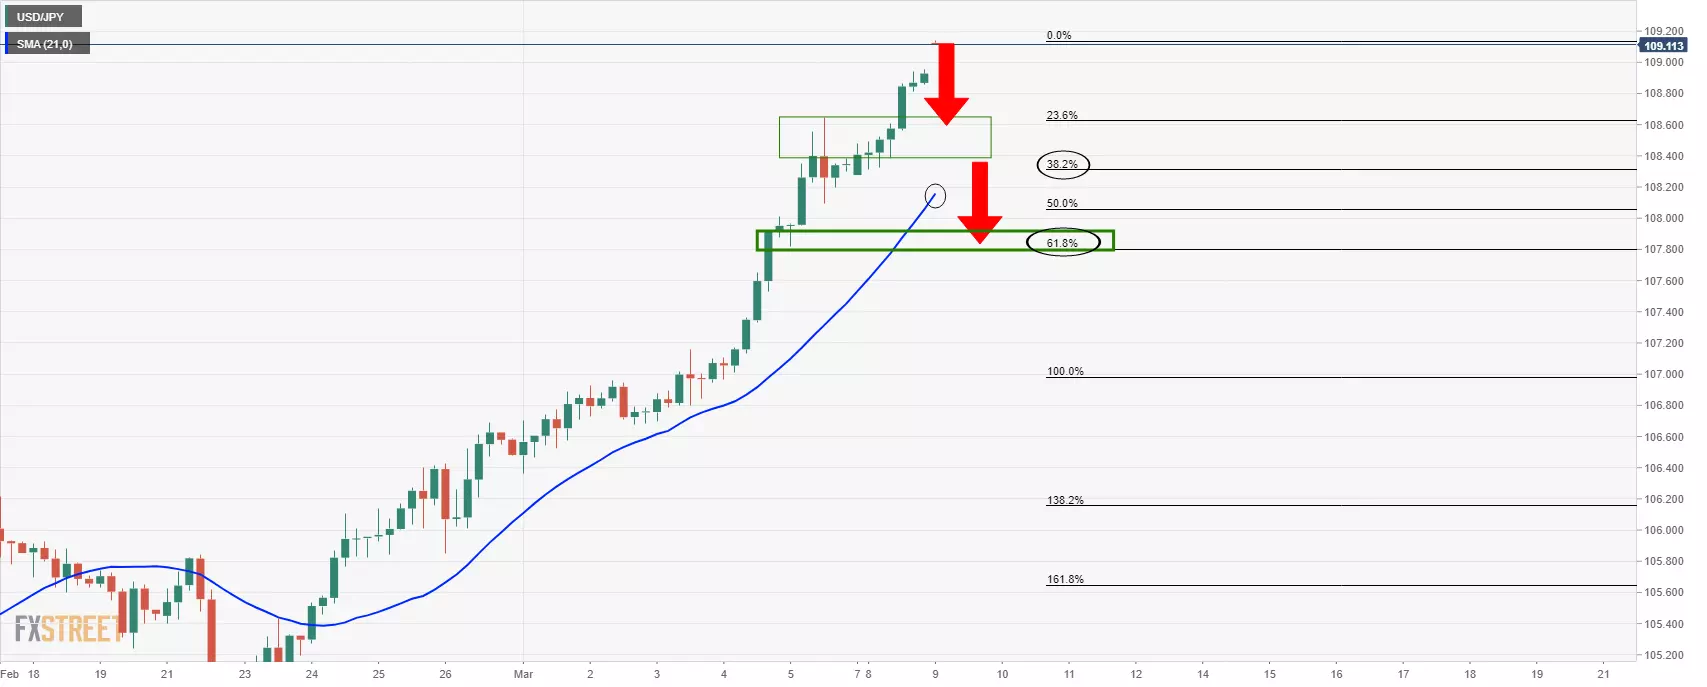
The 4-hour conditions are not favourable until a break of the 21 moving average and prior resistance structure.
