- USD/JPY closes the hour below 100-HMA for the first since Sept 2.
- The spot bounces-off key support while within a symmetrical triangle.
- Sentiment on Wall Street and dollar dynamics eyed for fresh direction.
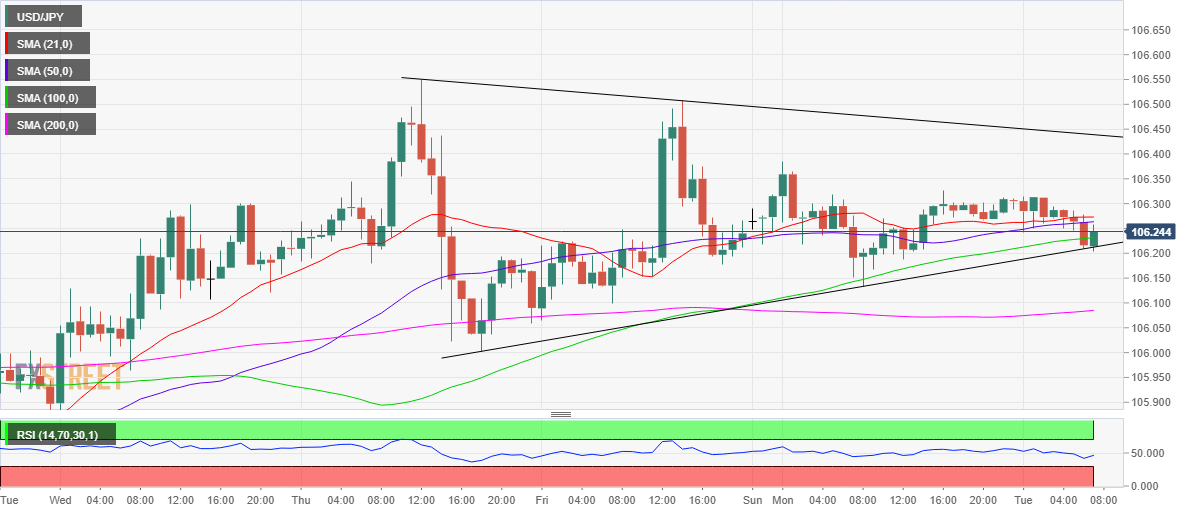
USD/JPY holds the lower ground on the 106 level so far this Tuesday, having bounced-off a drop to the critical support of the rising trendline support at 106.20.
Despite the bounce, the downside appears more compelling, as the price gave an hourly closing below the 100-hourly Simple Moving Average (HMA) for the first time since September 2.
An hourly closing below the said trendline support would confirm a symmetrical triangle breakdown. A sharp drop could be triggered, with the next downside target seen at the horizontal 200-HMA at 106.08.
The hourly 14-day Relative Strength Index (RSI) has inched upwards, still trades below the midline in the bearish territory.
To the upside, the confluence of the 21 and 50-HMAs at 106.27 will likely limit the immediate bounce.
Further north, the daily high of 106.31 will be next in focus. Acceptance above the 106.50 level could negate the near-term bearish bias.
USD/JPY: Hourly chart
USD/JPY: Additional levels
