- USD/JPY is consolidating the recent losses.
- The level to beat for bears is the 110.00 figure.
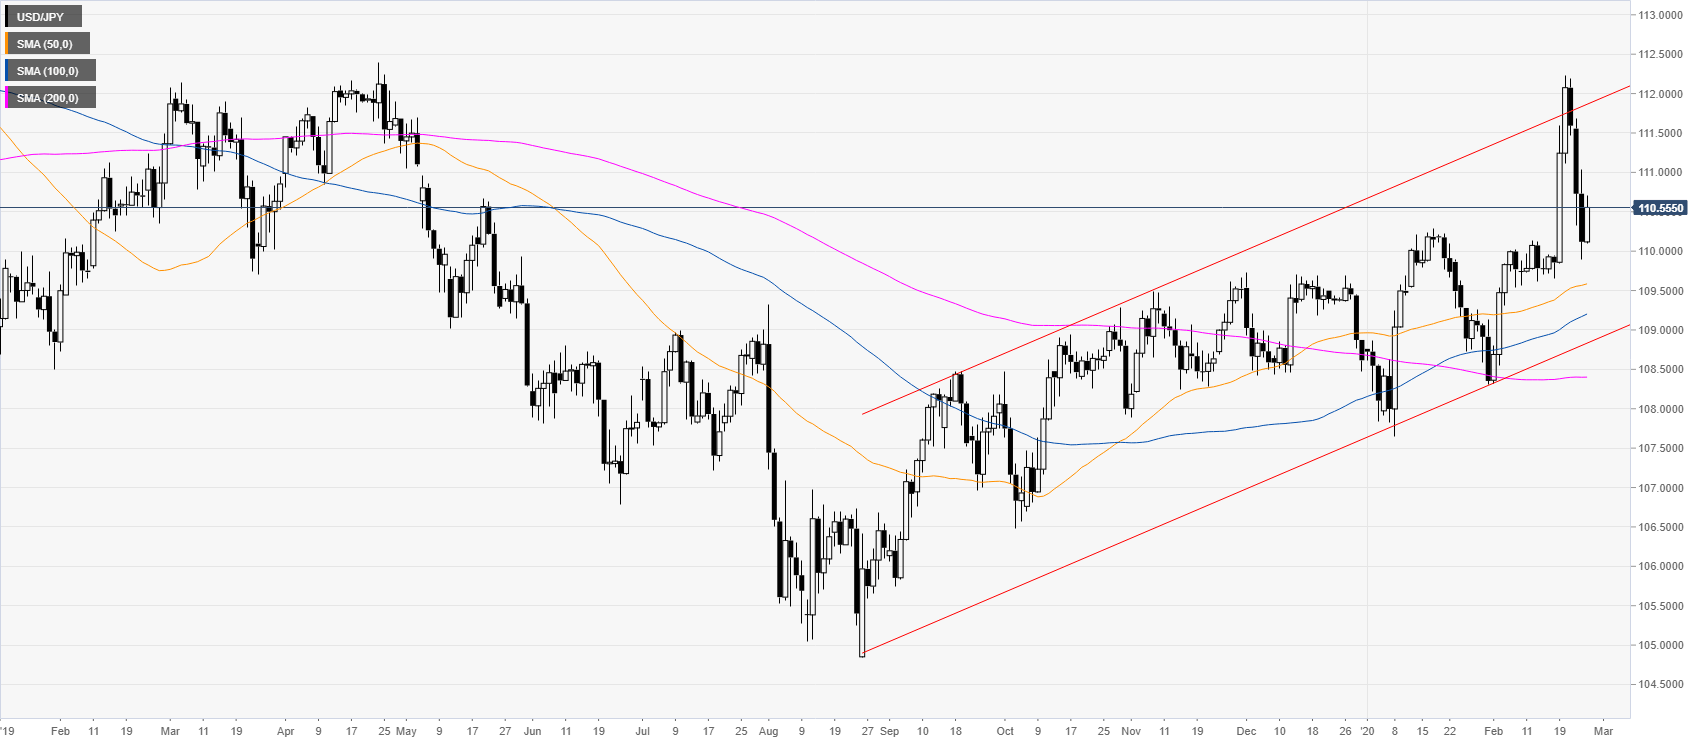
USD/JPY daily chart
USD/JPY is trading in a bull channel while above its main daily simple moving averages (SMAs). The spot is pulling back down after a huge breakout last week.
USD/JPY four-hour chart
USD/JPY is trading in the 110.00/110.60 range while trading between the 50 and the 100 SMAs. As the market is consolidating the recent drop the bears might try to break below the 110.00 support to reach 109.40 and 108.60 on the way down. Resistances are seen near the 110.65 level and the 111.00 figure.
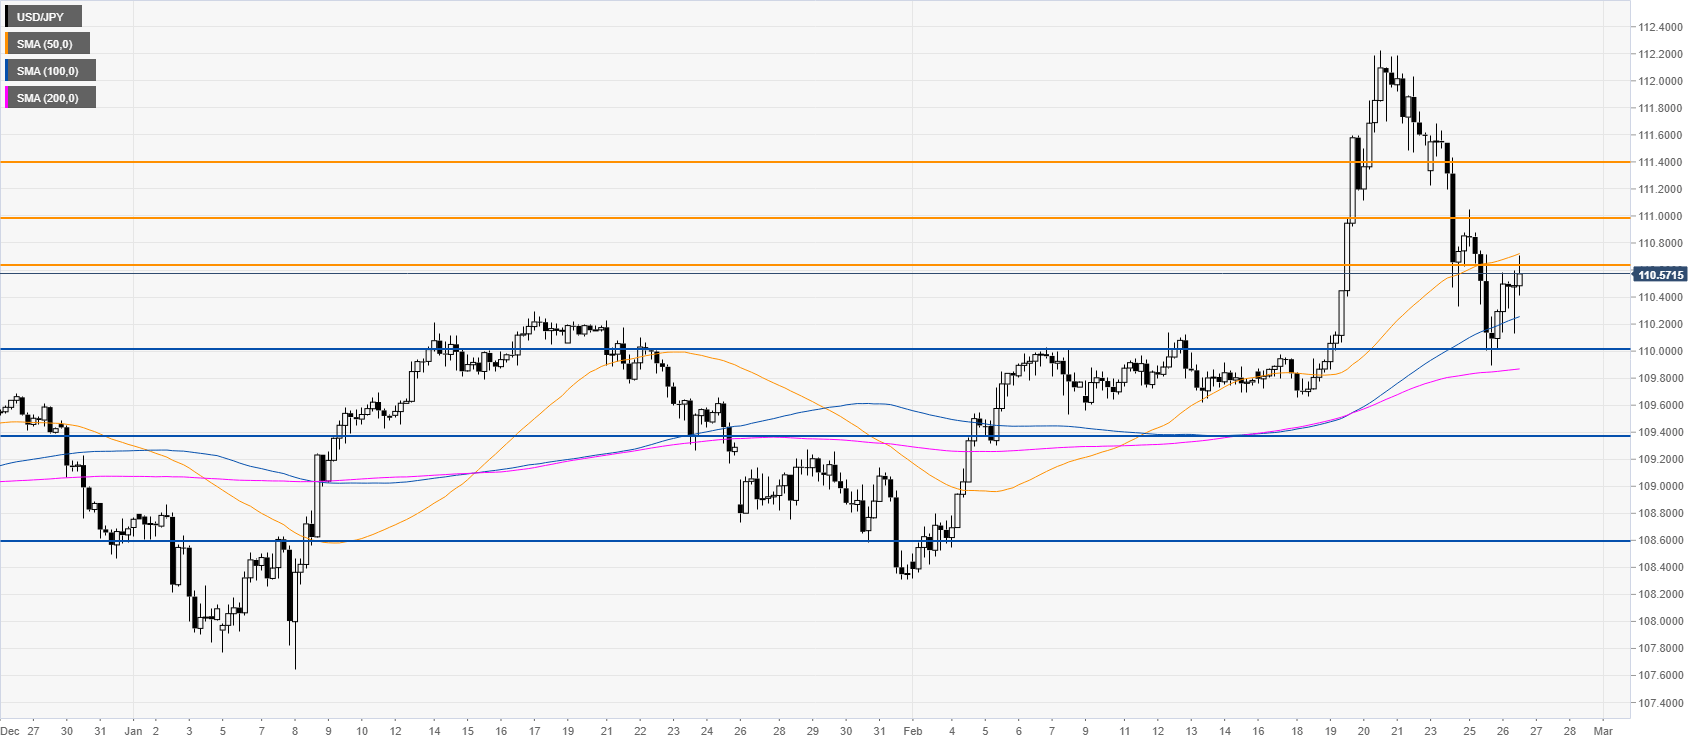
Resistance: 110.65, 111.00, 111.40
Support: 110.00, 109.40, 108.60
Additional key levels
