- USD/JPY trades close to a long-held 200-month SMA.
- A violation there would shift risk in favor of a drop to deeper support levels.
USD/JPY is currently trading near 104.10, representing a 0.12% drop on the day. The bears failed to establish a foothold under the 200-month Simple Moving Average (SMA) of 103.92 earlier this month.
The bears have failed several times in the past four years to force a monthly close under the long-term average.
As such, the 200-month SMA is the level to defend for the bulls. If the pair ends below that average line on Monday, more substantial selling pressure may emerge, yield a more profound drop toward 101.18 (March low).
A close above resistance at 104.76 (Nov. 24 high) would confirm a short-term bullish reversal and open the doors to 105.68 (Nov. 11 high).
Monthly chart
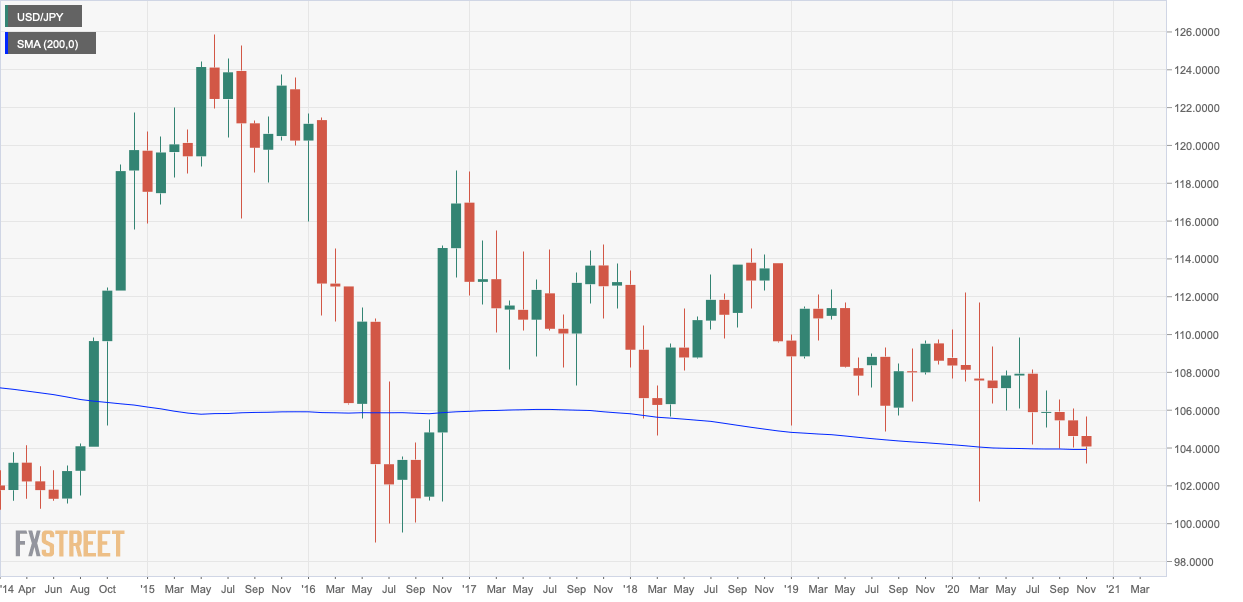
Trend: Bearish below 200-month MA
Technical levels
