- USD/JPY is retracing in the New York session as Trump cast doubts about the US-China trade deal.
- Support is seen at the 109.29 and 108.95 price levels.
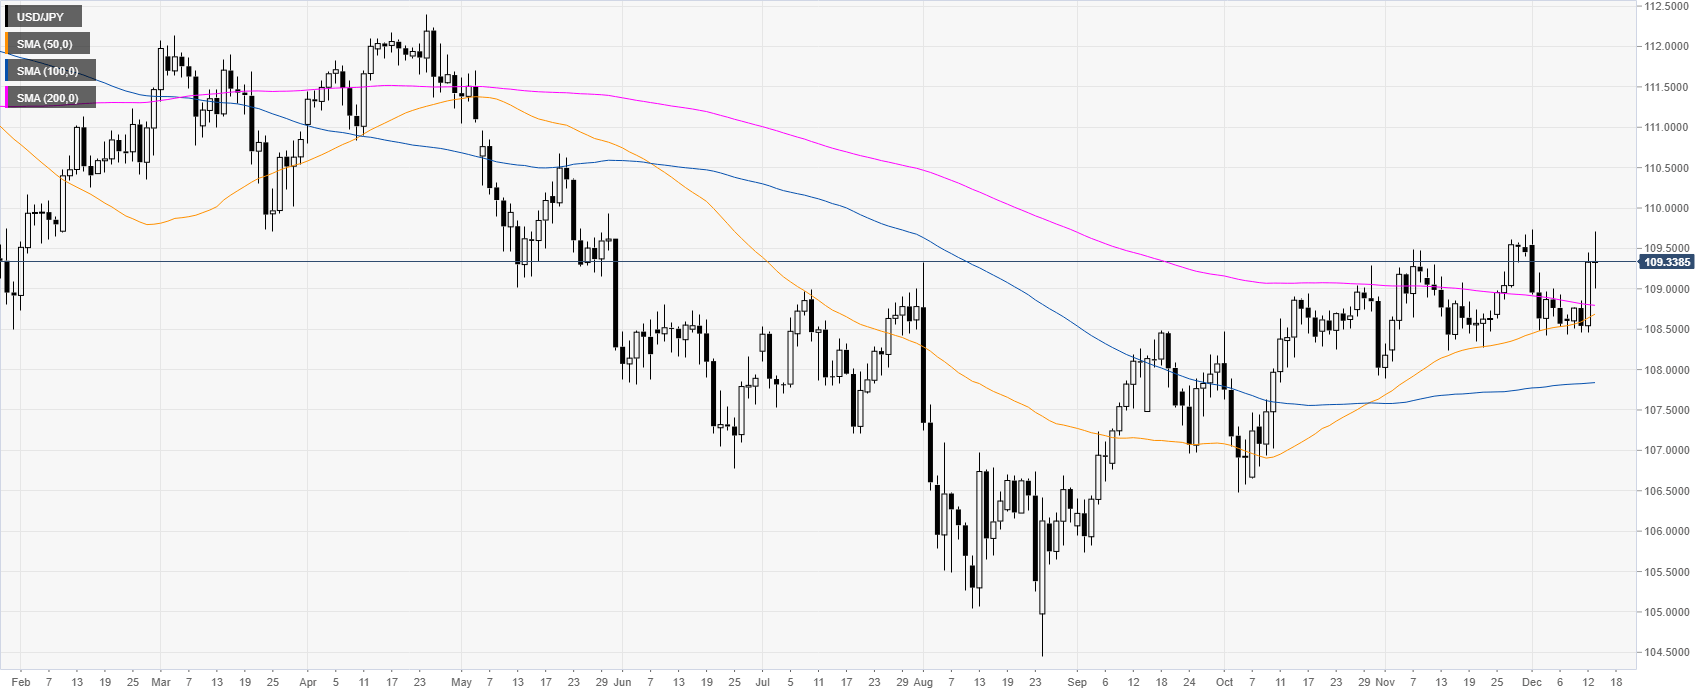
USD/JPY daily chart
USD/JPY is off the monthly highs above the 109.00 handle and the 200-day simple moving average (DMA). The yen is back on demand as US President Trump said that that the Wall Street Journal story on China deal is completely wrong.
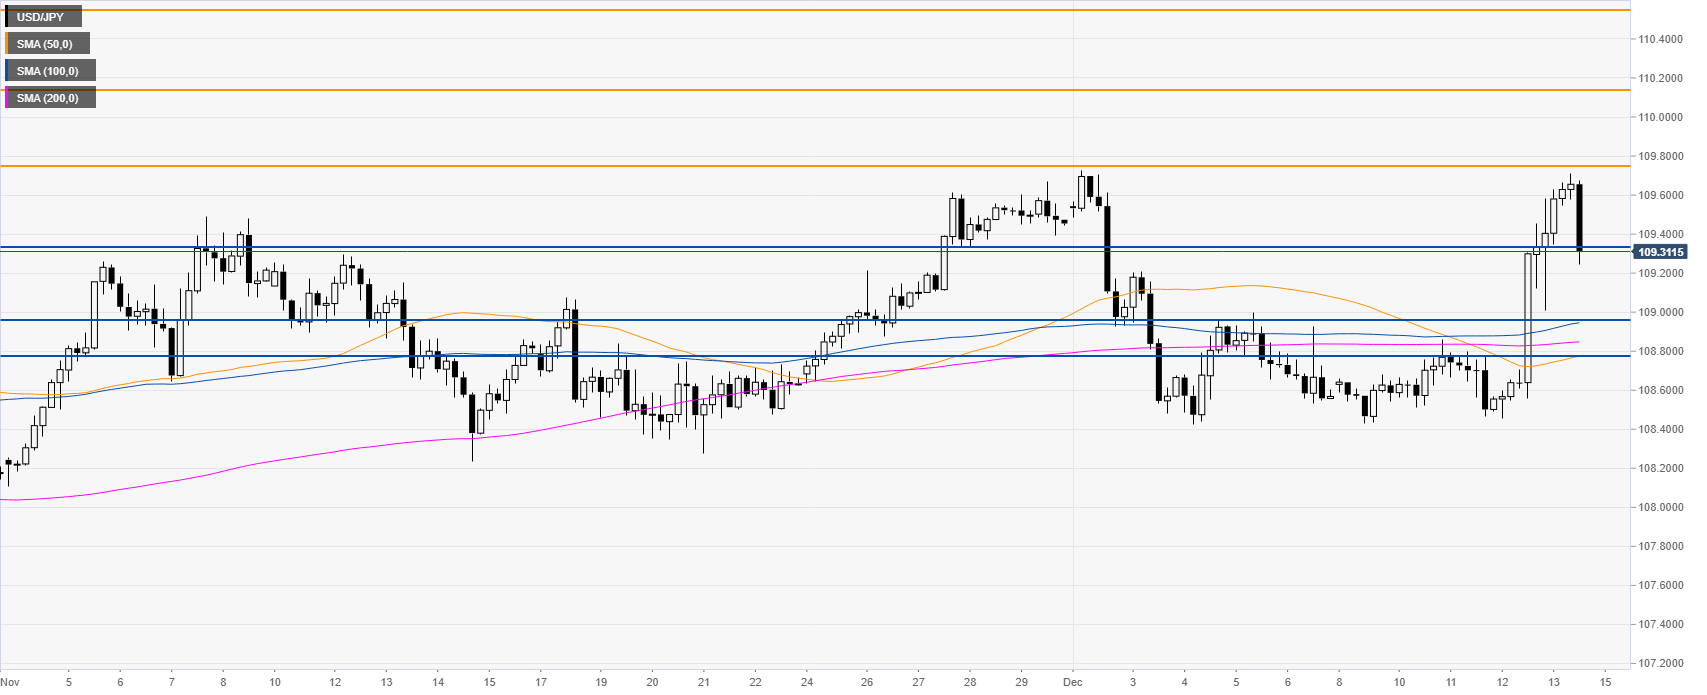
USD/JPY four-hour chart
The market is pulling back after a strong bullish advance. The market is finding some support near the 109.29 level. Further ranges are expected into the end of the week. However, next week, it will be interesting to see if the bulls will attack the 109.74 resistance. A breakout above this level can see the spot spike towards the 110.13 and 110.54 levels, according to the Technical Confluences Indicator. Support is seen at the 109.29, 108.95 and 108.78 price levels, according to the Technical Confluences Indicator.
Additional key levels
