- USD/JPY is losing steam on US dollar weakness.
- USD/JPY is about to challenge the 107.00 support.
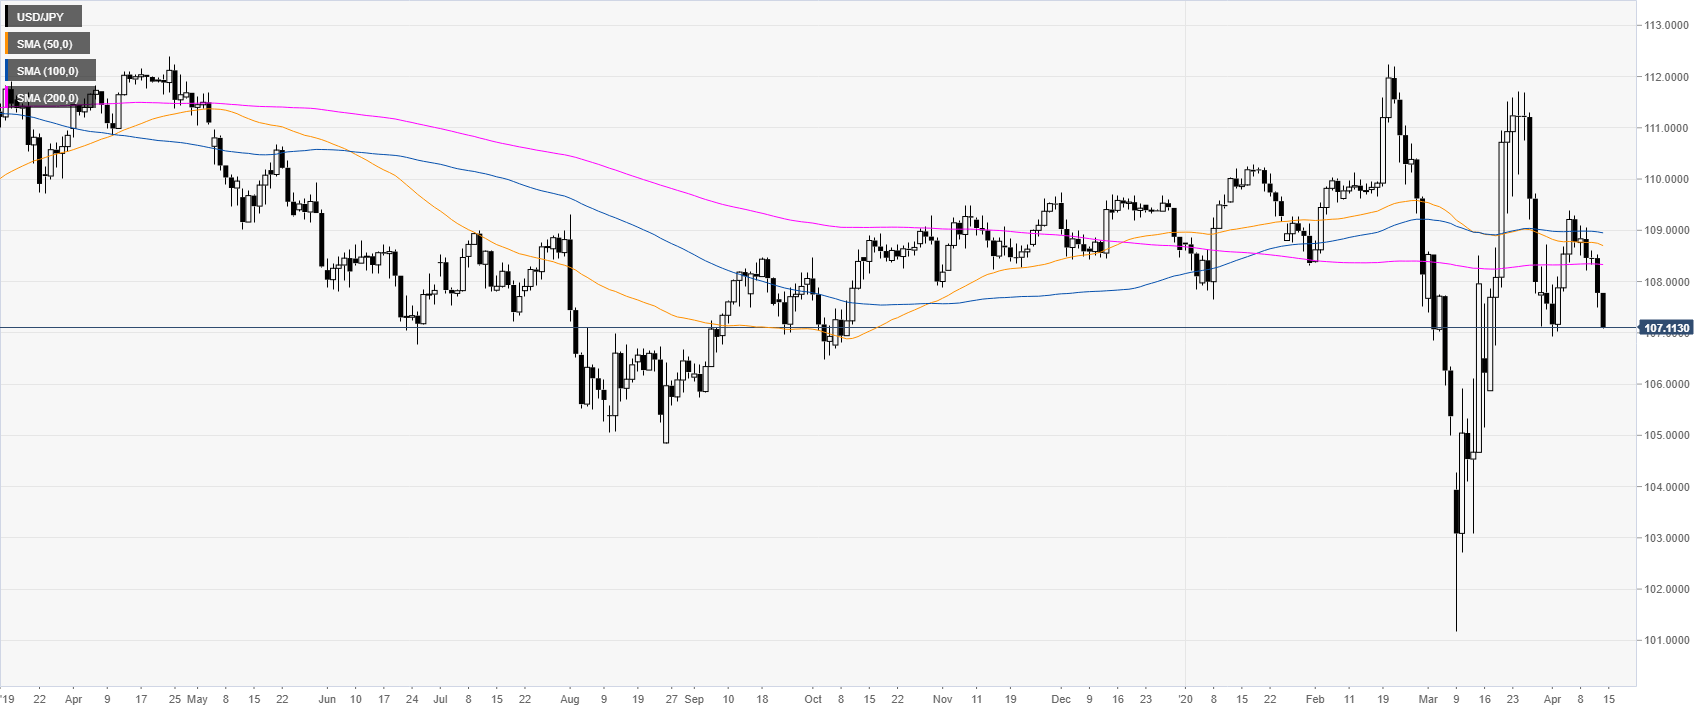
USD/JPY daily chart
USD/JPY is trading below the main DMA (daily simple moving average) on the daily chart as the spot is nearing the April’s lows.
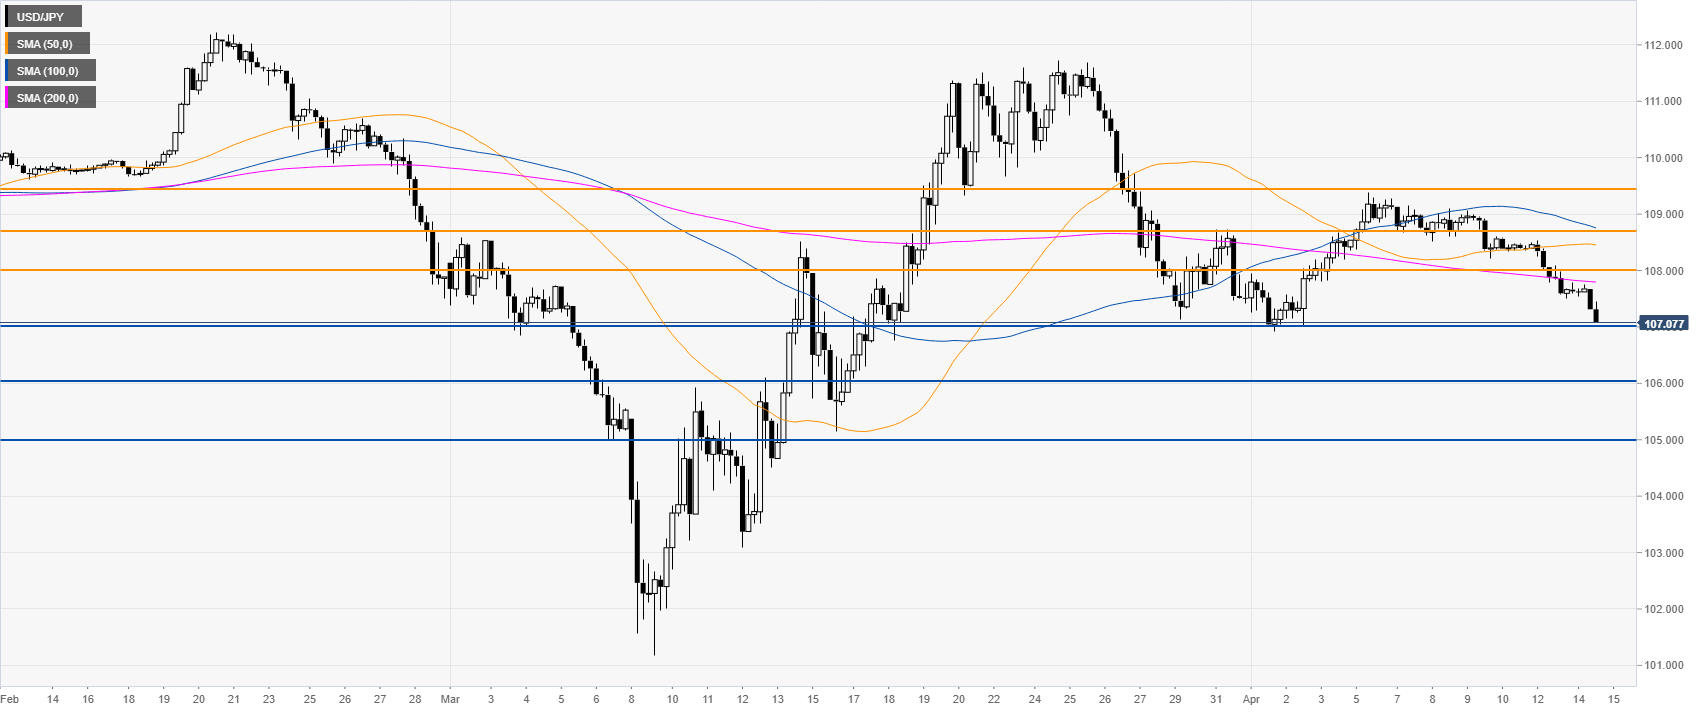
USD/JPY four-hour chart
USD/JPY is trading below the main SMAs on the four-hour chart suggesting a negative bias in the medium term. The spot is nearing the 107.00 figure near April’s lows. A break below the mentioned level could imply further losses towards the 106.00 or the 105.00 levels. Resistance can be seen near the 108.00 and 108.70 levels.
Additional key levels
