- USD/JPY is easing from February highs.
- The rising wedge pattern can put bearish pressure on USD/JPY.
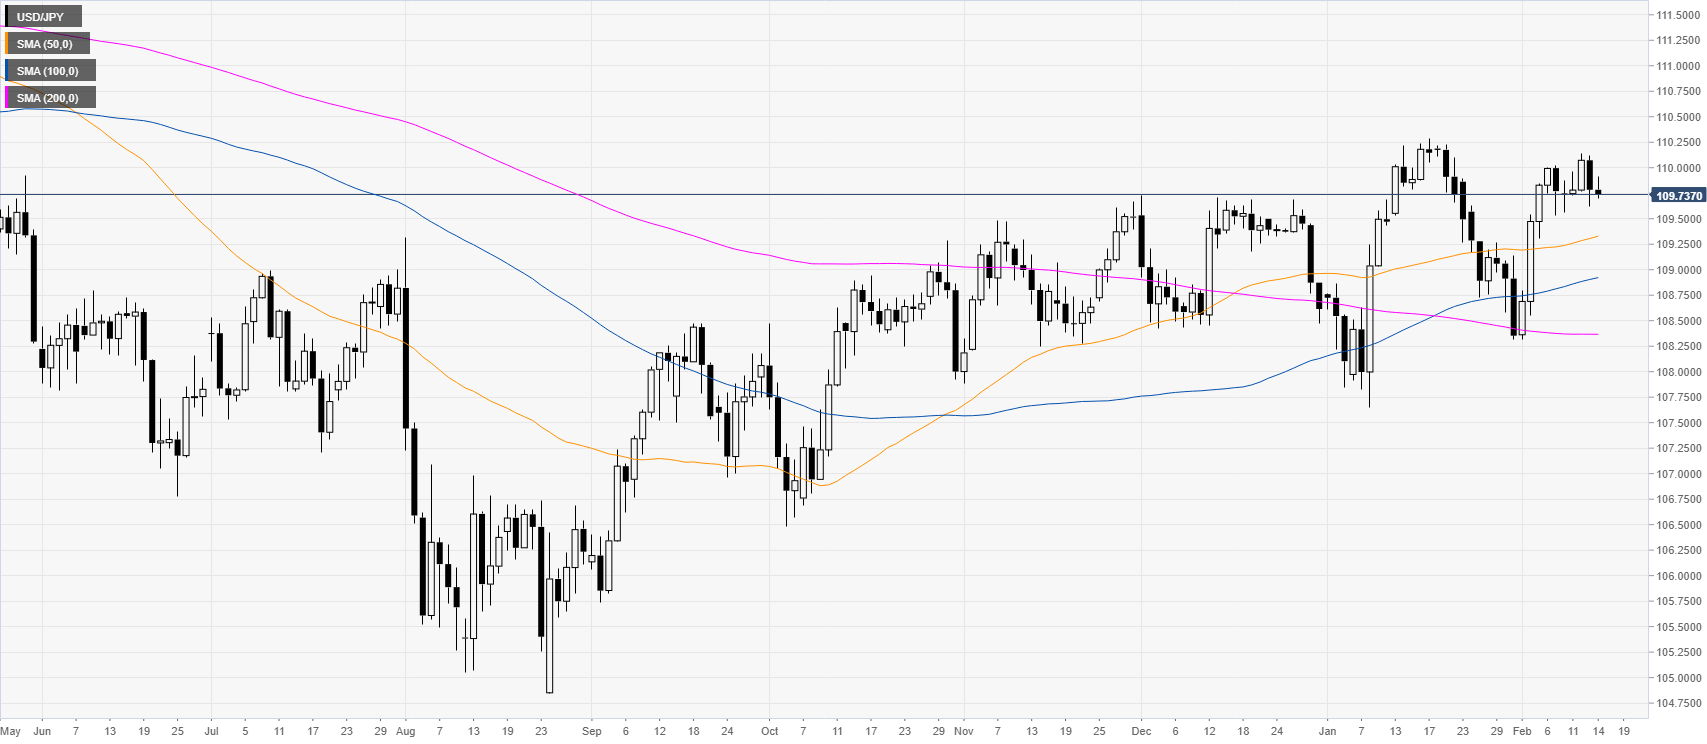
USD/JPY daily chart
USD/JPY is easing from February highs below the 110.00 figure while trading above its main daily simple moving averages (SMAs).
USD/JPY four-hour chart
USD/JPY broke below a rising wedge formation while above the 100/200 SMAs. The spot is easing from the 109.82 resistance as bears want to break below the 109.59 support and drive the market towards the 109.36 and 109.02 levels. On the flip side, a daily close above the 110.00 resistance might invalidate the bearish scenario, according to the Technical Confluences Indicator.
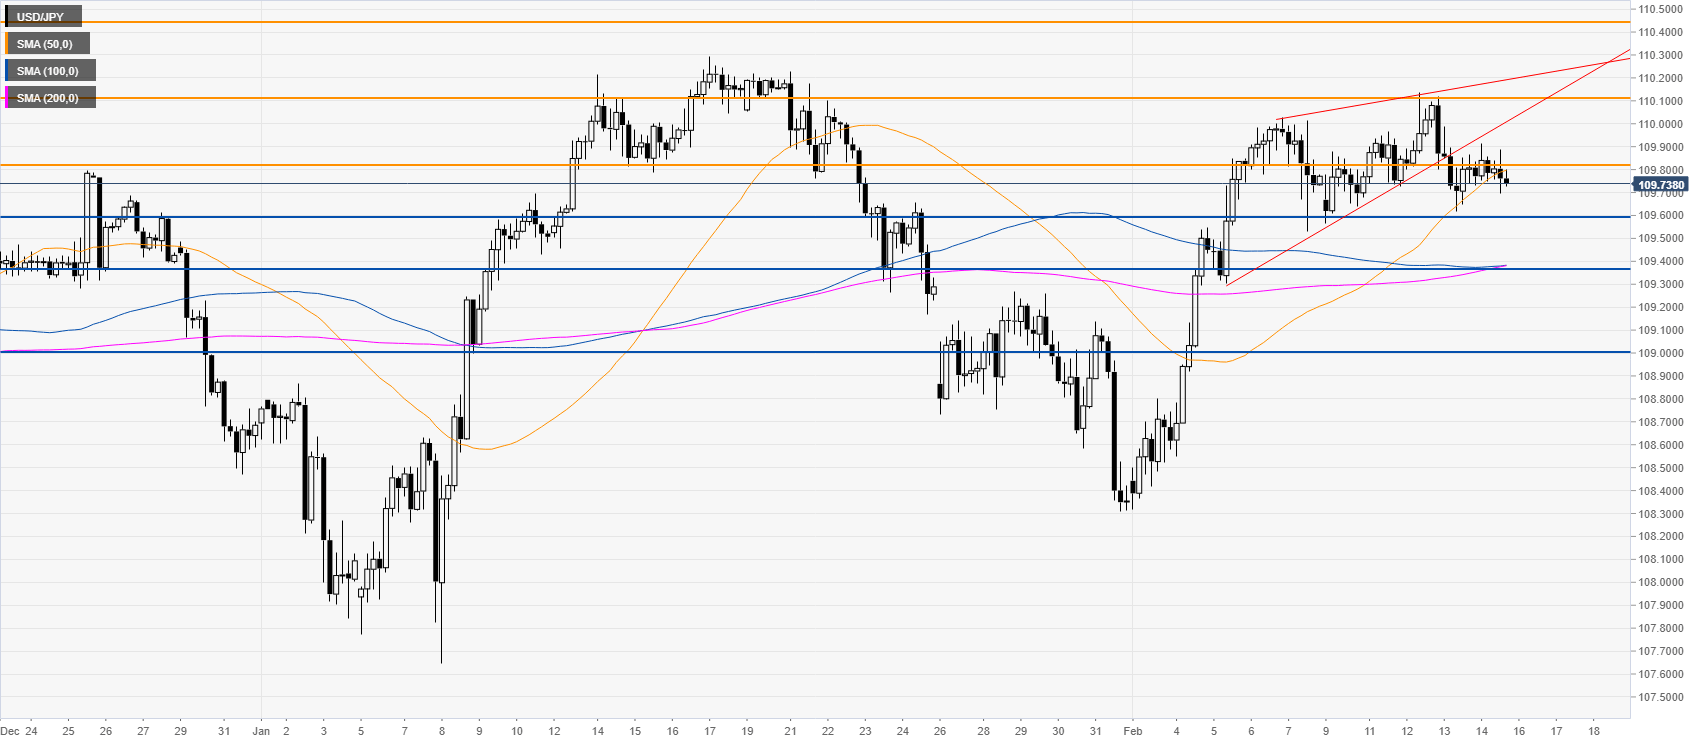
Resistance: 109.82, 110.10, 110.45
Support: 109.59, 109.36, 109.02
Additional key levels
