- USD/JPY is trading mixed this Wednesday while being capped below the 108.00 figure.
- The level to beat fro bears is the 107.00 support.
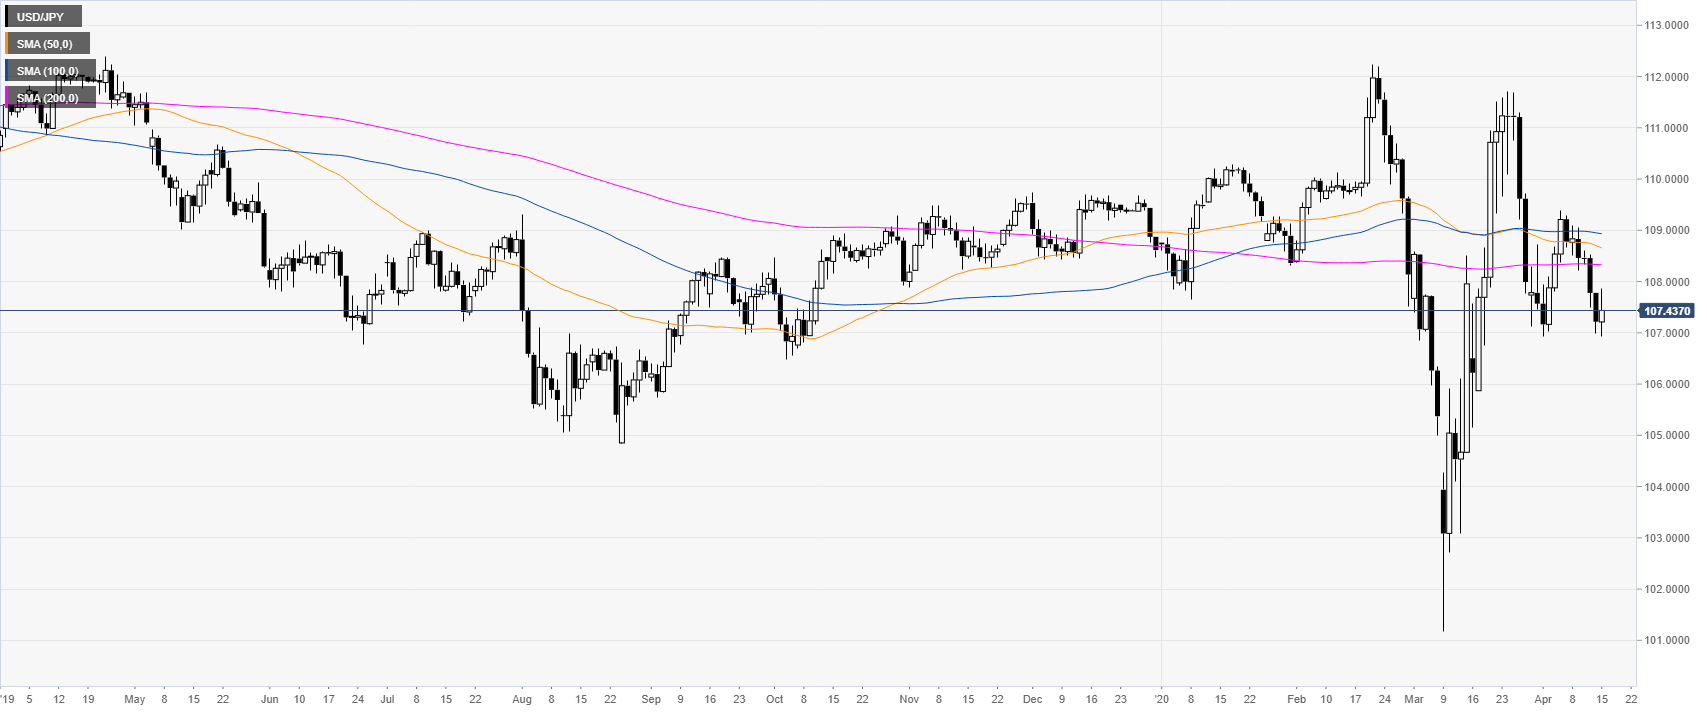
USD/JPY daily chart
USD/JPY is trading below its main DMAs (daily simple moving averages) on the daily chart as the spot is rebounding from the April’s lows.
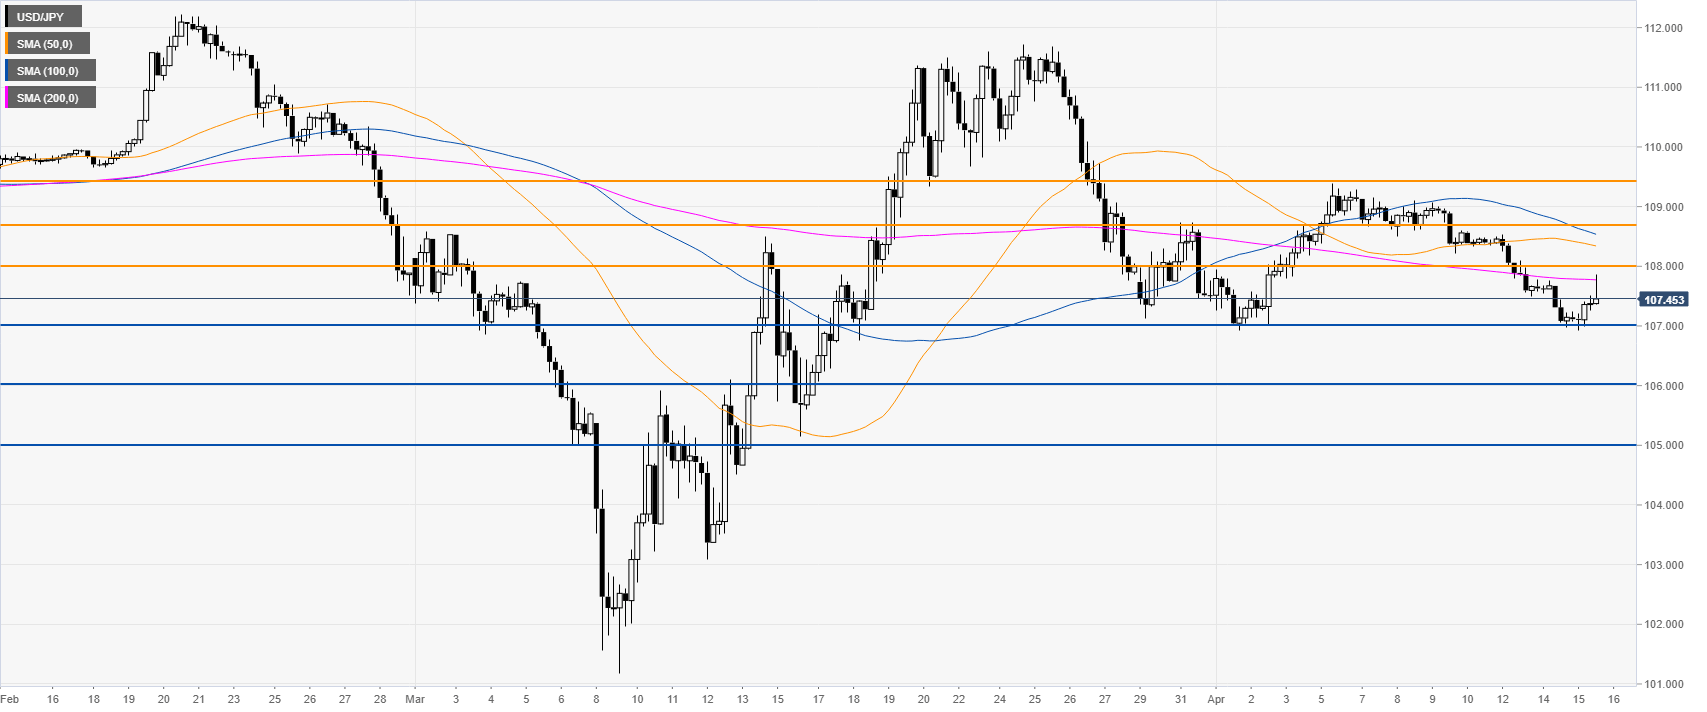
USD/JPY four-hour chart
USD/JPY is trading below its main SMAs on the four-hour chart suggesting a bearish bias in the medium term. The spot is rejecting the 108.00 figure and the 200 SMA. A break below the 107.00 figure near April’s lows could lead to a dip down towards the 106.00 or the 105.00 levels. Resistance can be seen near the 108.00 and 108.70 levels.
Additional key levels
