- USD/JPY fails to extend pullback moves from 107.57.
- 107.70/72 acts as an additional upside barrier, 107.00 offers extra filter to the south.
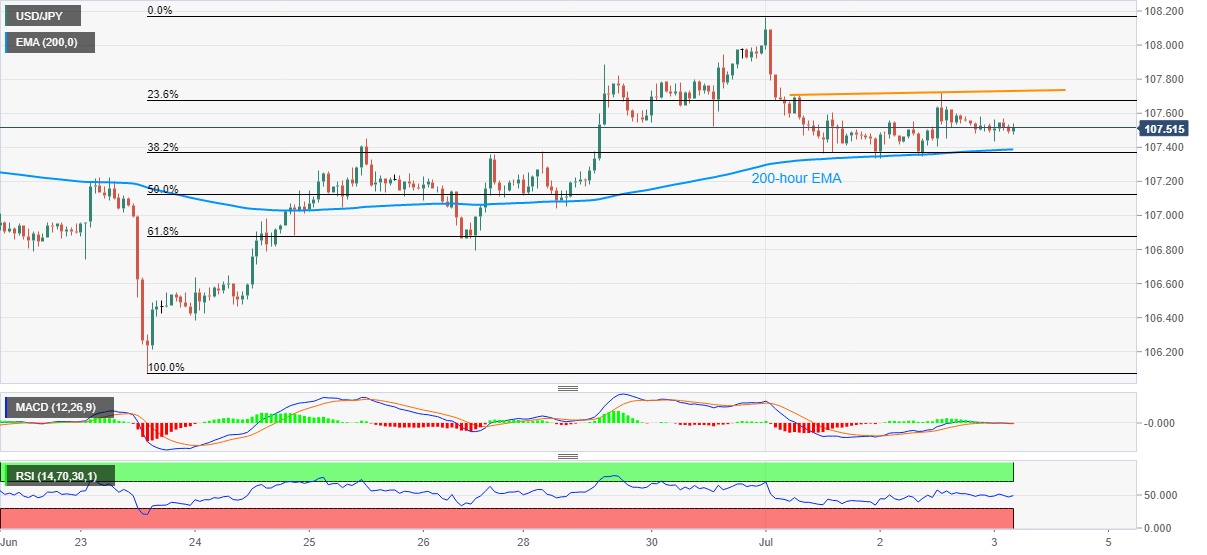
- RSI, MACD suggest no major moves inside the immediate range.
USD/JPY keeps the 107.34-72 range, currently around 107.53, during the pre-European session on Friday. In doing so, the pair takes the support of 200-hour EMA while refrains from rising past-early Wednesday highs. Also magnifying the traders’ indecision could be the RSI and MACD conditions that indicate no major moves.
Even so, the pair’s upside momentum since late-June favors the bulls. As a result, a clear break beyond 107.72 could trigger the quote’s rise to 108.00 round-figures. However, the current month high near 108.17 might question the pairs’ further advances.
Given the buyers’ ability to conquer 108.17, 109.00 and April month high near 109.40 might entertain them ahead of pushing towards the previous month’s top of 109.85.
Meanwhile, the pair’s declines below a 200-hour EMA level of 107.39 can recall 107.00 on the charts. Though, 61.8% Fibonacci retracement of June 23 to July 01 rise, around 106.87, may restrict further weakness.
During the quote’s additional downside after 106.87, 106.65 and June 23 bottom surrounding 106.07 will be on the bears’ radars.
USD/JPY hourly chart
Trend: Sideways
