- USD/JPY trims early-day losses with a bounce off 105.72.
- 12-day-old resistance line defends bears, monthly falling trend line and 200-bar SMA add to the upside barriers.
- Short-term horizontal support can offer immediate rest.
USD/JPY rises to 105.79 during the early trading hours of Monday. Even so, the pair loses 0.12% on a day while defying Friday’s halt to a three-day losing streak.
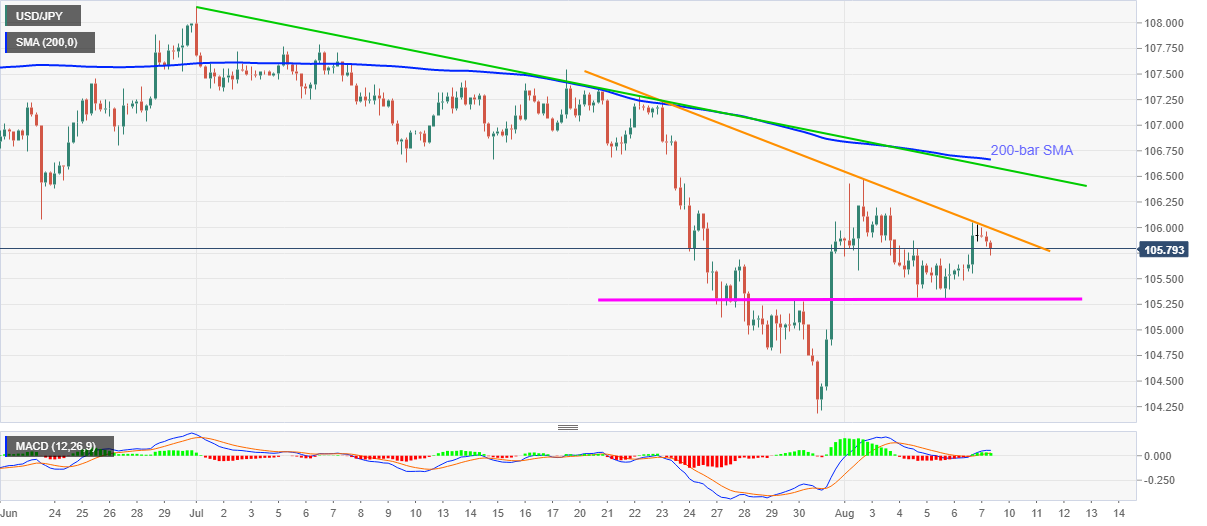
Although MACD flashes bullish signals, the pair’s immediate upside is challenged by a falling trend line from July 23, at 106.00 now, a break of which could escalate the recovery moves to another resistance line, from July 01, currently around 106.60, followed by 200-bar SMA level of 106.67.
In a case where the bulls manage to dominate past-106.70, the late-July top near 107.55 will flash on their radars.
Alternatively, two-week-old horizontal support near 105.30 can entertain the short-term sellers ahead of driving them towards the July month low near 104.20.
However, 104.80 and 105.00 are some extra buffers that the pair could avail during the further downside.
USD/JPY four-hour chart
Trend: Bearish
