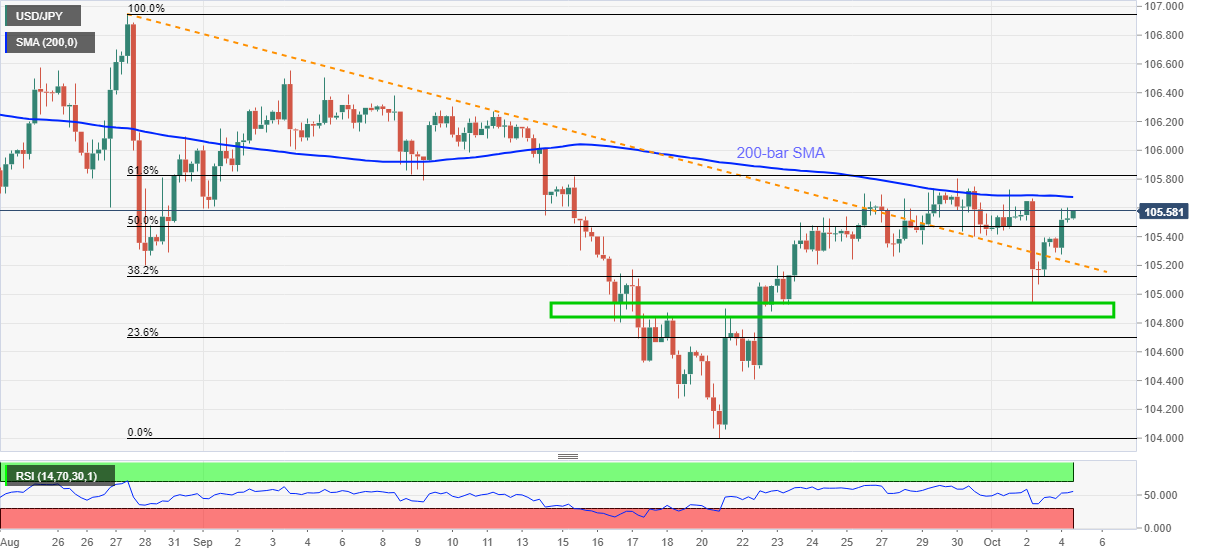
USD/JPY extends late-Friday’s bounce off 104.94 towards the key SMA resistance.
- A sustained trend line breakout, normal RSI favor the bulls.
- 61.8% of Fibonacci retracement offers extra filter to the north.
- Broad support on the downside below 105.00 can probe the bears.
USD/JPY rises to 105.57, up 0.24% intraday, while heading into the European open on Monday. In doing so, the pair keeps its upside break of a falling trend line from August 28 amid normal RSI conditions.
As a result, bulls are geared towards a 200-bar SMA level of 105.67 and 61.8% Fibonacci retracement of August 28 to September 21 downside, around 105.85, during the further upside.
During the USD/JPY bulls’ further dominance past-105.85, multiple resistances can probe the upside below 106.30, a break of which will attack the previous month’s peak surrounding 106.55.
Alternatively, the resistance-turned-into-support trend line around 105.20 and the 105.00 threshold offer immediate support during the quote’s U-turn.
Though, USD/JPY sellers will be hard to convince unless breaking a broad support area between 104.95 and 104.85 including multiple levels marked since mid-September.
USD/JPY four-hour chart
Trend: Bullish
