- USD/JPY’s immediate bias is neutral as the pair is stuck in a pennant pattern.
- A pennant breakout would confirm a reversal higher from the multi-month bearish trend.
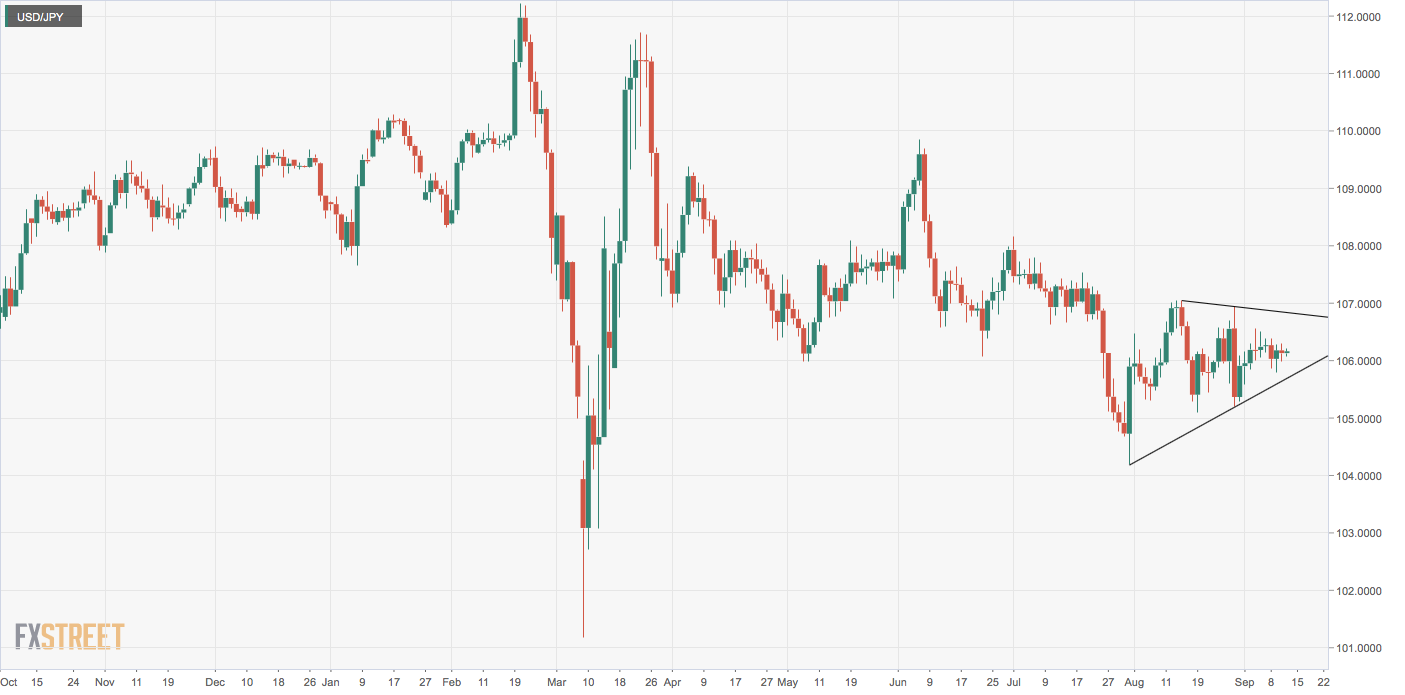
USD/JPY has charted a series of higher lows and lower highs or a pennant pattern on the daily over the past five weeks.
A close above the pennant’s resistance would imply an end of the sell-off from March highs above 111.50 and bullish reversal. In that case, the pair could challenge resistance at 108.16 (July 1 high).
On the other hand, a pennant breakdown would signal a continuation of the bearish trend from March highs and expose support at 104.18 (July 31 high).
USD/JPY is trading unchanged on the day at 106.17. The upper and lower ends of the pennant are seen at 106.85 and 105.68, respectively.
Daily chart
Trend: Neutral
Technical levels
