- USD/JPY challenges key resistance near 105.00.
- US dollar remains bid amid a flight to safety, T-yields fall.
- Bullish crossover as well as RSI on 1H chart keeps buyers hopeful.
USD/JPY bounces-off strong support near the 104.65 region to challenge the 105 level on Monday, helped by the recovery in the US dollar across the board amid a flight to safety.
Surging coronavirus cases in Europe and the US remains a cause for concerns for the investors, as they seek safety in the world’s reserve currency, the greenback.
However, the further upside could remain elusive amid a 3% sell-off in the Treasury yields, as risk-aversion also lifts the demand for the US Treasuries across the curve.
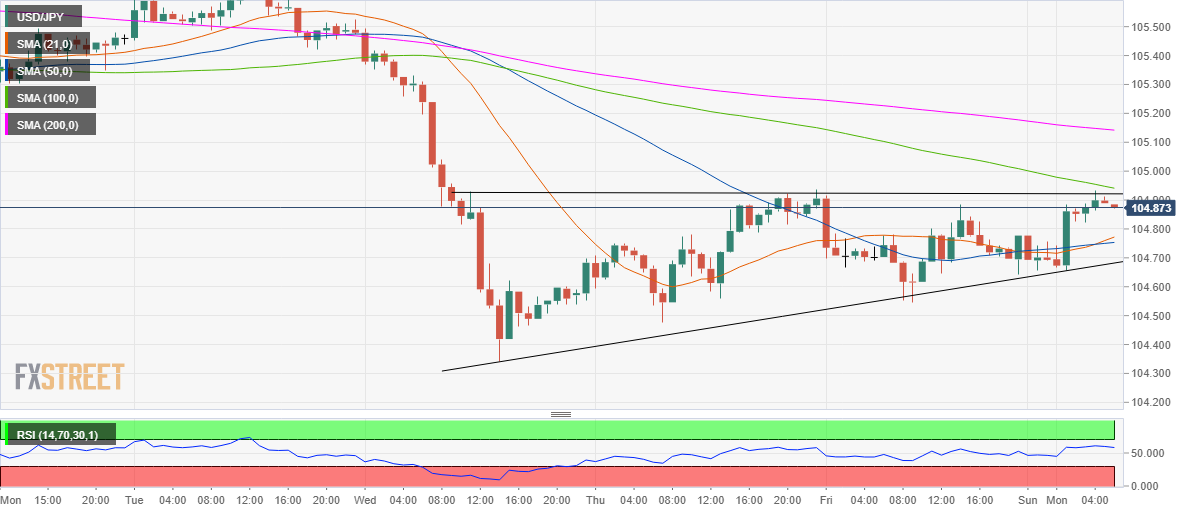
The same is being depicted by the hourly chart, as the price struggles to take on the upside while it teases an ascending triangle breakout.
Bulls need acceptance above 104.94, the confluence of the bearish 100-hourly moving average (HMA) and the horizontal trendline resistance, to validate the pattern, opening doors towards the 200-HMA at 105.14.
The hourly Relative Strength Index (RSI) stays well above the midline, suggesting that there is more room for gains. Meanwhile, the 21 and 50-HMAs bullish crossover also adds credence to the upside bias in the near-term.
To the downside, the immediate cushion is placed at 104.75, where the 21 and 50-HMA lie. A drop below which could put the ascending trendline support of 104.68 at risk.
USD/JPY: Hourly chart
USD/JPY: Additional levels
