- USD/JPY fails to extend Friday’s recovery moves.
- Fed surprised markets with a rate cut and QE, cancels this week’s FOMC meeting.
- August 2019 low on the bears’ radar.
USD/JPY remains on the back foot around 106.40, down 1.42%, in a reaction to the Fed’s surprise during early-Monday in Asia.
Read: Powell speech: The Fed is going to “go in strong” on asset purchases
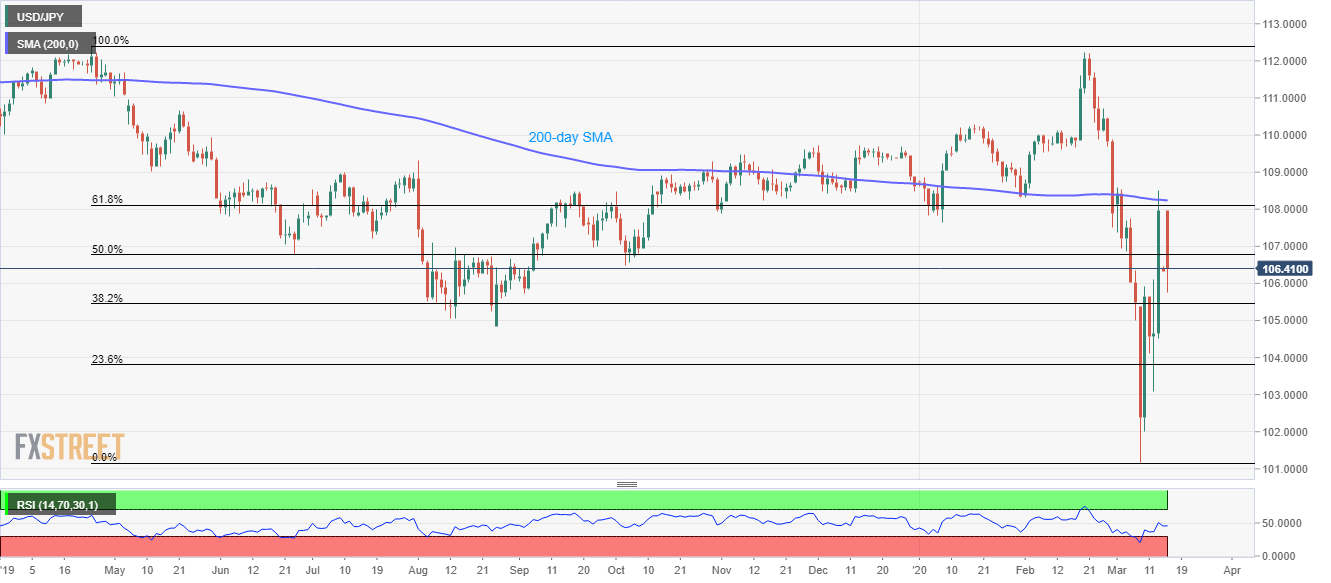
In doing so, the yen pair fails to hold onto its recovery gains from Friday while also staying below 61.8% Fibonacci retracement of its fall from April 2019 and 200-day SMA.
That said, the pair currently declines towards 38.2% Fibonacci retracement level, around 105.45, whereas August 2019 low near 104.85 could become the bears’ favorite afterward.
On the upside, 61.8% of Fibonacci retracement, near 108.10, followed by a 200-day SMA of 108.25, act as the immediate upside barriers for the pair.
Should there be a sustained run-up past-108.25, buyers can aim for 109.50/55 ahead of January month high near 110.30.
USD/JPY daily chart
Trend: Bearish
