- USD/JPY picks up bids following its latest U-turn from 105.29.
- A monthly resistance line, previous support, joined bearish MACD to question the bulls.
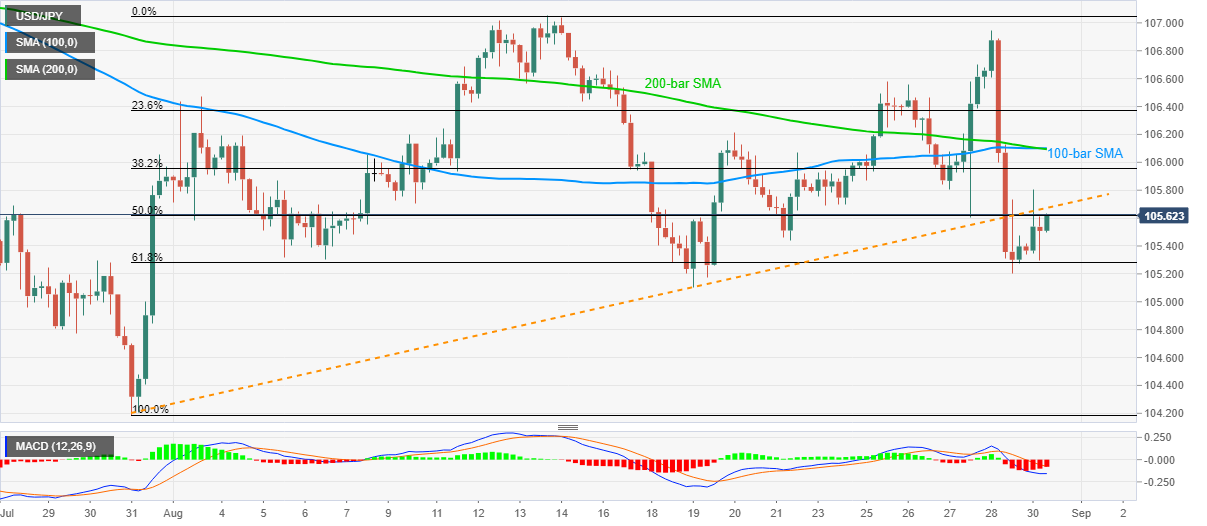
- 61.8% Fibonacci retracement of July-August upside restricts immediate declines.
USD/JPY rises to 105.61, up 0.25% on a day, during the pre-European session trading on Monday. The yen pair recently picked bids as market sentiment turned positive amid coronavirus (COVID-19) vaccine hopes. Also, receding uncertainty surrounding Japan’s leadership after PM Shinzo Abe further propels the risk-on mood.
While portraying the same, the S&P 500 Futures refresh record high above 3,500 whereas stocks in Asia-Pacific are led by over 1.9% gains of Japan’s Nikkei 225.
As a result, the quote extends its Friday’s bounce off the key Fibonacci retracement support to challenge the previous support line, at 105.67 now.
However, bearish MACD and multiple failures to cross the same support-turned-into-resistance question the optimists.
Even if the pair manages to cross 105.67 resistance, a confluence of 100 and 200-bar SMA level near 106.10 acts as the key upside filter.
Alternatively, a downside break of 105.27, comprising 61.8% Fibonacci retracement, needs validation from the monthly low of 105.10 to target 104.80 and late-July low near 104.20.
USD/JPY four-hour chart
Trend: Pullback expected
