- USD/JPY bounces off 40-month low, remains on the Bears’ radar.
- 23.6% Fibonacci retracement adds strength to the resistance.
- The year 2016 low seems to lure the sellers.
Despite bouncing off more than three-year low of 101.56, currently around 102.50, USD/JPY remains on the back foot during the early Monday.
The reason could be spotted in the pair’s sustained trading below an ascending trend line stretched since late-March 2018 as well as bearish MACD signals.
As a result, sellers can keep the helm unless prices bounce back beyond 105.00-105.15 region, comprising the said support-turned-resistance and 23.6% Fibonacci retracement of June 2015 to June 2016 fall.
That said, 101.00 and 100.00 psychological magnet could be the next on the stop during the southward trajectory whereas the year 2016 low near 99.00 will question the bears afterward.
On the upside break of 105.15, October 2019 low near 106.50 and January 2020 bottom surrounding 107.65 can please the bulls.
USD/JPY weekly chart
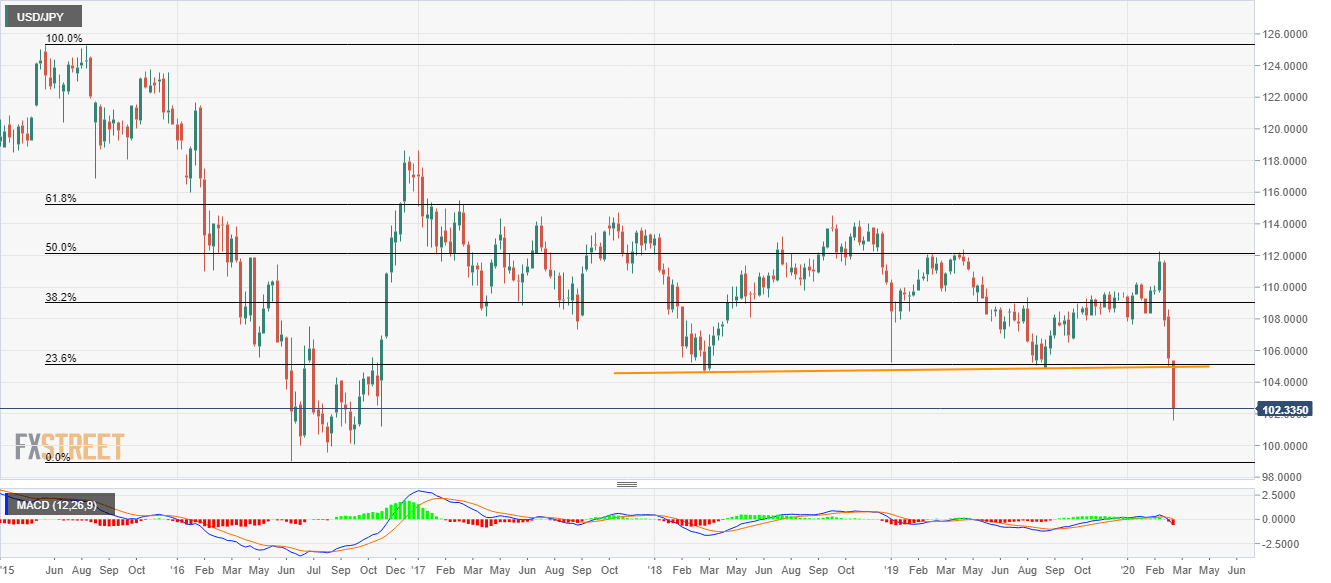
Trend: Bearish
