- USD/JPY gathering pace for a break above the 108 level.
- Symmetrical triangle breakout on hourly chart points to extra gains.
- Hourly RSI also back the case for further upside.
USD/JPY is on a steady rise so far this Tuesday, as the bulls look to conquer the 108 handle despite the broad US dollar weakness.
The spot appears to track the bounce in the S&P 500 futures, as minor gains in the European stock futures point to the upbeat market mood. Markets are pinning on hopes of a global economic upturn, as economic lockdowns are lifted worldwide.
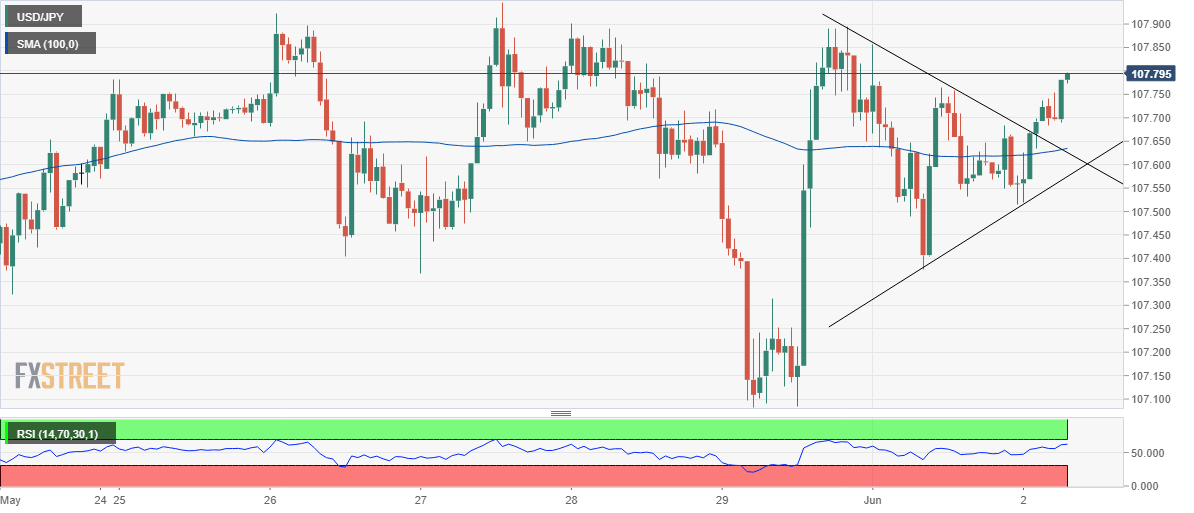
It remains to be seen now if the price can advance further, in light of looming US-China tensions. The technical set up, however, continues to favor the bulls, with a symmetrical triangle breakout spotted on the hourly chart earlier today.
As the price broke above the 107.66 resistance, the pattern got confirmed. The next upside target is seen at 107.89 (Monday’s high), above which the 108 level will be tested. The pattern target of 108.18 will come into play on a break above the round figure. The hourly Relative Strength Index (RSI) points towards the overbought territory near 61.53, suggesting additional room for gains.
Any pullback will meet some fresh demand near 107.62/60 region, the confluence of the former trendline resistance now-turned support and the horizontal 100-hourly Simple Moving Average (SMA). Sellers would target the 107.50 psychological level on a breach of the latter.
USD/JPY: 1-hour chart
USD/JPY: Additional levels
