- USD/JPY rebound from 106.60 area has stalled below 108.00
- The dollar faces resistance at the 50-day SMA and previous tops in the 108.00/05 area
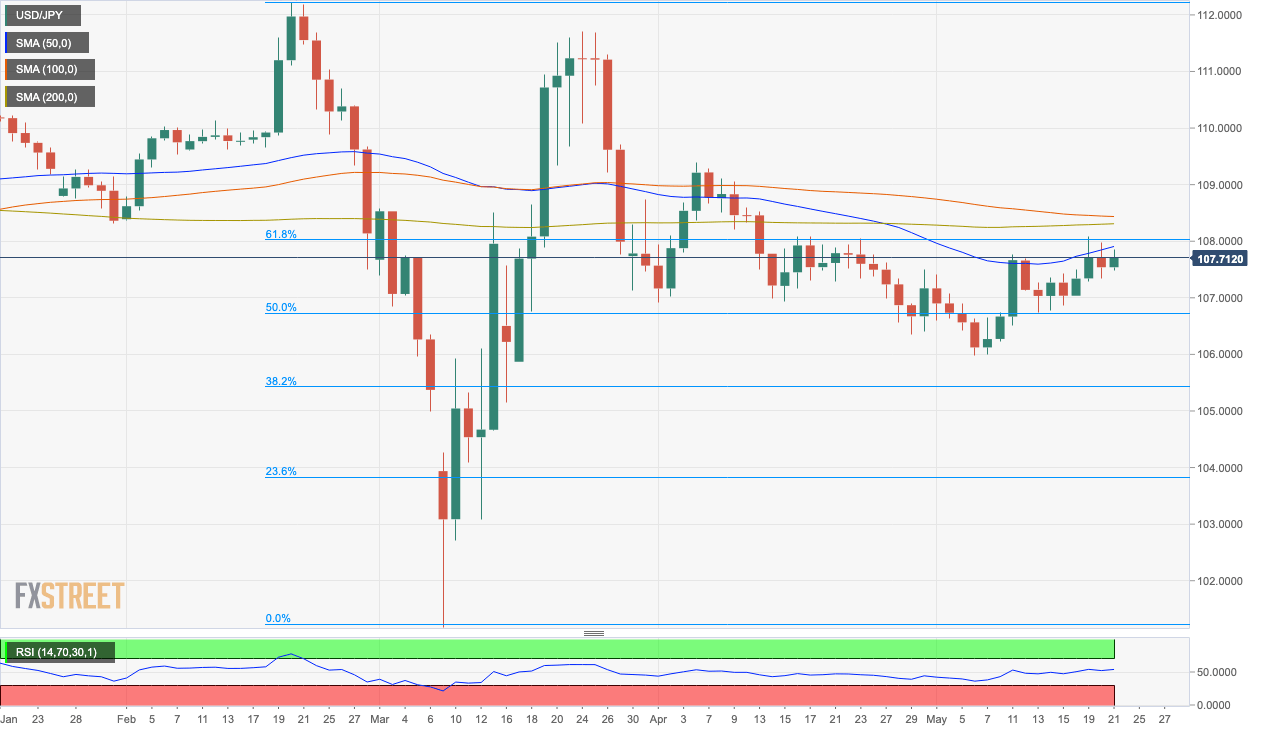
US dollar’s mild rebound from the mid-range of 106.00 last week has been halted at 108.00, where the pair seems to be facing an important resistance area.
The USD/JPY picked up earlier this week, with the yen somewhat weaker amid a moderate recovery on risk appetite. Initial plans to ease coronavirus restrictions in the major economies have boosted hopes of an economic recovery which fuelled riskier assets against the safe-haven yen. The pair, however, has been unable to extend past 108.00, and it has remained practically flat over the last sessions.
The daily chart shows the USD/JPY limited below an important resistance hurdle around 108.00. The 50-day SMA, which capped the pair on May 11 and 12, lies now at 107.95 and right above it, there is the 61.8% retracement of the February-March decline concurring with mid and late-April tops at 108.00/05.
The dollar should break above that area to increase bullish momentum. In that case, the next targets would be the 100 and 200-days SMA’s around 108.30/40 on its way towards 109.38 (April 4 high). On the downside, immediate support lies at 107.30 (May 19 low) and below there, 106.60 (May 13 low) and 106 (May 6 and 7 lows).
USD/JPY daily chart