- USD/CAD remains confined in a narrow trading band through the early North American session.
- The range-bound price moves constitute the formation of a bullish continuation rectangle pattern.
- Slightly overbought RSI on the daily chart seemed to hold traders from placing fresh bullish bets.
The USD/JPY pair extended its sideways consolidative moves through the early North American session and remained confined in a narrow trading band, above mid-110.00s.
The yield on the benchmark 10-year US government bond retreated further from 14-month tops touched early this week and slipped below the 1.70% threshold on Thursday. This act as a headwind for the US dollar bulls, which, in turn, kept a lid on any meaningful upside for the USD/JPY pair.
The USD remained depressed following the release of rather disappointing US Initial Weekly Jobless Claims, which unexpectedly jumped to 719K last week. That said, a generally positive risk tone undermined the safe-haven Japanese yen and helped limit any losses for the USD/JPY pair.
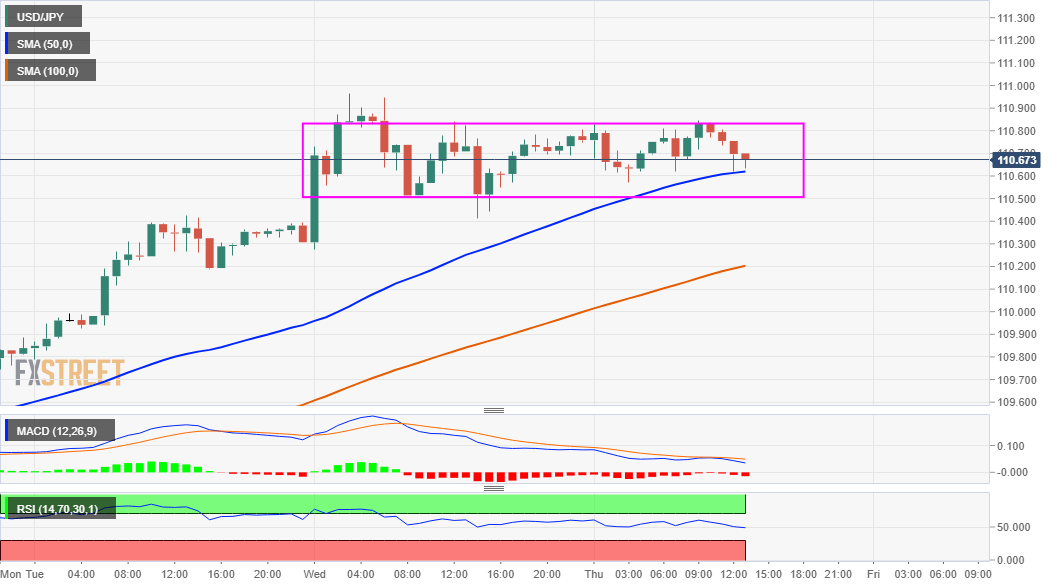
From a technical perspective, the intraday price action constitutes the formation of a rectangle pattern on 1-hour chart. Given the recent strong positive move to one-year tops, the pattern would be categorized as a bullish continuation that marks a brief pause in the well-established trend.
Meanwhile, RSI (14) on the daily chart is holding above the 70.00 mark and points to slightly overstretched conditions. This seemed to be another factor that might hold traders from placing fresh bullish bets and positioning for any further appreciating move for the USD/JPY pair.
Nevertheless, the near-term bias remains tilted in favour of bullish traders and supports prospects for additional gains. Hence, any dips below the trading range support might be seen as a buying opportunity and remain limited near the 100-hour SMA support, currently near the 110.20 region.
This is closely followed by the key 110.00 psychological mark, which if broken decisively might prompt some aggressive long-unwinding trade. The USD/JPY pair might then accelerate the corrective fall towards testing weekly swing lows, around the 109.35 region touched on Monday.
On the flip side, the 110.85 region now seems to act as an immediate resistance ahead of the 111.00 round-figure mark. A sustained strength beyond will be seen as a fresh trigger for bullish traders and push the USD/JPY pair further towards March 2020 swing highs, around the 111.70 area.
USD/JPY 1-hour chart
Technical levels to watch
