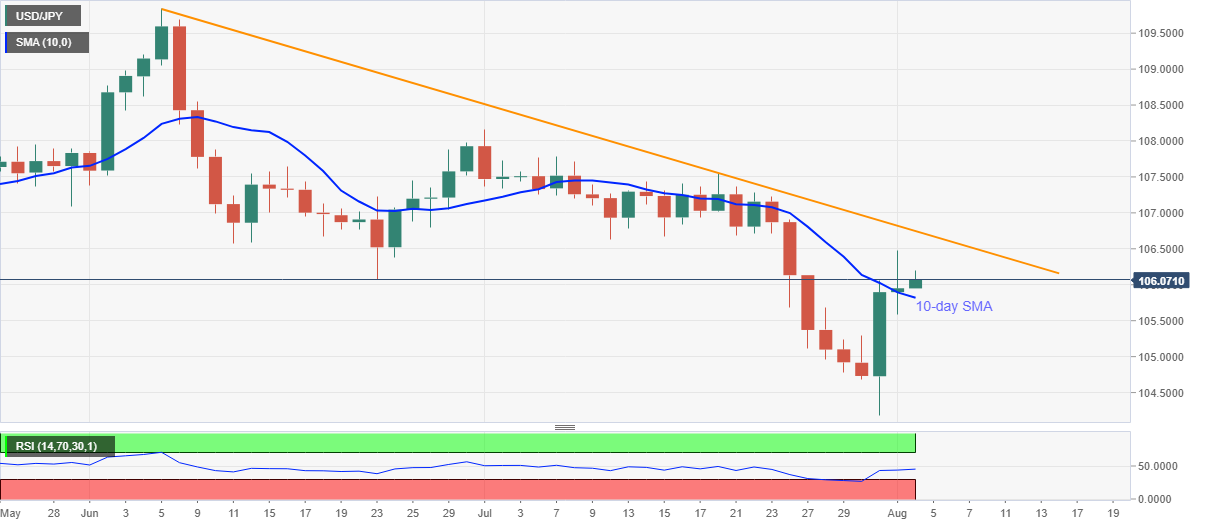
- USD/JPY carries an upside break of 10-day SMA despite Monday’s pullback form 106.47.
- Normal RSI, a three-day winning streak favor the bulls to attack a falling trend line from June 05.
- 105.30 can offer immediate support during the pair’s U-turn.
USD/JPY prints 0.13% gains on a day while trading around 106.10 during the pre-European session on Tuesday.
The pair crossed 10-day SMA for the first time in over two weeks on Monday. The same helps the quote to extend Friday’s recovery moves from the lowest since March 12 towards a short-term descending resistance line.
Other than the 106.75 immediate upside barrier, comprising the said trend line, multiple lows marked during the early June and July months, around 106.55/60 also questions the pair buyers.
In a case where the USD/JPY prices cross 106.60, 107.55 and July month top close to 108.15 will grab the market attention.
Meanwhile, a daily closing below 10-day SMA level of 105.82 can take rest on 105.30 before revisiting the five-month lows near 104.20.
USD/JPY daily chart
Trend: Further recovery expected
