The USD/JPY price drops aggressively as the JP225 is trading in the red. On the other hand, Nikkei’s drop signals that the Japanese Yen could appreciate versus its rivals. The currency pair is trading in the red at 108.92 below 109.06 former low.
–Are you interested to learn more about automated forex trading? Check our detailed guide-
The bias is bearish, so DXY’s further decline could also help the bears to drag the pair lower. The USD’s depreciation is natural after some poor US data was reported yesterday. The ISM Manufacturing PMI was reported at 59.5 points below the 60.8 estimate.
On the other hand, the Japanese Yen has received a helping hand from the Japanese Final Manufacturing PMI, Consumer Confidence, and from the Tokyo Core CPI data. The economic indicators have reported better than expected data.
We cannot exclude a temporary rebound after the current sell-off as the DXY has started to increase. The USD buyers are expecting strong US data during the week. The NFP is expected around 895K in July versus 850k in June, while the Unemployment Rate could drop from 5.9% to 5.7%.
Also, the Average Hourly Earnings, Unemployment Claims, ISM Services PMI, and the ADP Non-Farm Employment Change will be released as well.
USD/JPY price technical analysis:
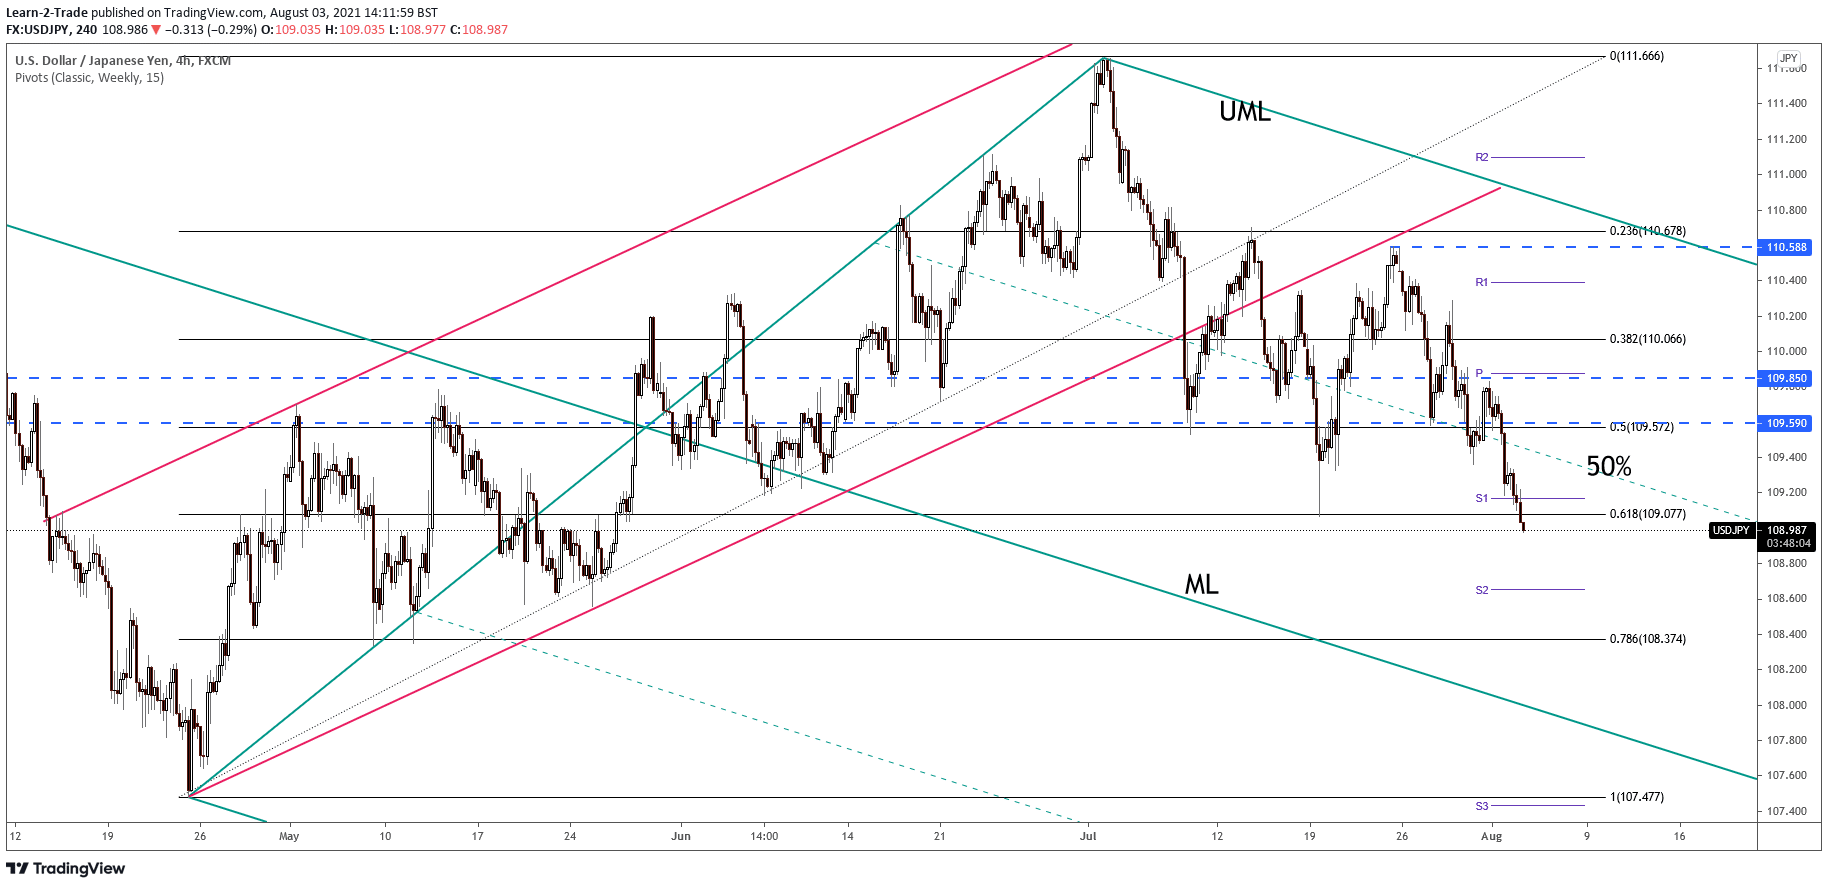
The USD/JPY pair drops right now only because the Nikkei (JP225) is into a strong sell-off. The pair dropped below the 61.8% retracement level signaling a larger downside movement. Its failure to approach and reach the descending pitchfork’s upper median line (UML) signals a potential drop towards the median line in the coming period.
–Are you interested to learn more about forex trading apps? Check our detailed guide-
Technically, USD/JPY could try to recover after the current massive drop. Still, the pressure will be high as long as it’s located under the 61.8% level and below the 50% Fibonacci line of the descending pitchfork.
A short-term ABC bounce could help us to catch new downside movements. The immediate target, obstacle, is seen at the S2 (108.65), while the next one is represented by the 78.6% retracement level.
Looking to trade forex now? Invest at eToro!
67% of retail investor accounts lose money when trading CFDs with this provider. You should consider whether you can afford to take the high risk of losing your money.
