- USDJPY is pushing closer to 2002’s high at 135.20.
- Japan’s imports overwhelmed exports in April, further weakening the Yen.
- The price is overbought on the charts.
The USD/JPY price rose further on Thursday, reaching a 20-year low of 134.56 before recovering to 133.79. On January 31, 2002, the price reached 135.20, and a break above that would be its lowest since October 1998.
-Are you interested in learning about the best AI trading forex brokers? Click here for details-
The Yen has suffered against the dollar because of the divergence in central bank monetary policies between the US and Japan. While interest rates are rising worldwide in the United States, the Bank of Japan remains wedded to keeping policy highly stimulatory.
On Wednesday, Japan’s current account surplus fell sharply for April as imports overwhelmed exports, pushing the trade balance into the red. This news raises concerns about the country’s long-term purchasing power.
Overall, imports grew by 32.8% year-on-year due to the rising fuel cost, outpacing export growth from steel and car shipments. Although a weak yen inflated the cost of imports, its export boost was not as good as it once was because of the ongoing shift of exporters’ production abroad.
The dollar index is trading cautiously ahead of inflation data tomorrow. This data is set to influence the Fed’s monetary policy and possibly lead to a big move in USD/JPY.
USD/JPY key events today
With no important news releases from Japan, investors will be paying attention to the Initial Jobless Claims report from the United States. Investors expect the report to show an increase from 200K to 210K. Anything higher or lower could cause some volatility in the pair.
USD/JPY price technical analysis: Bulls eying 135.00
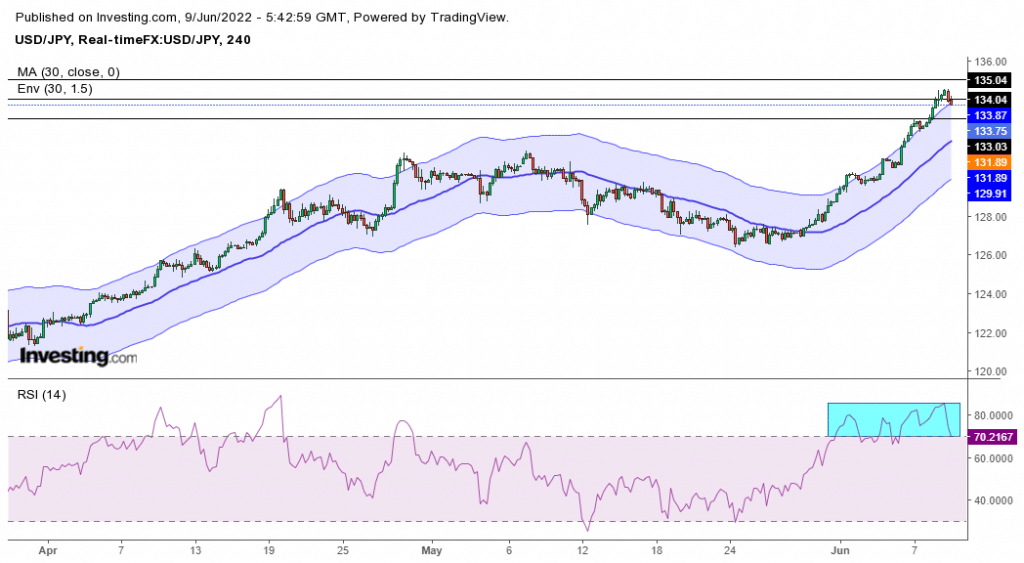
Looking at the 4-hour chart, we see a steep bullish trend. The price is constantly making higher highs and is trading at around 134.00. The RSI is in the overbought region. At this point, bears might come in to try and push the price lower.
-Are you interested in learning about the forex indicators? Click here for details-
The price has also been trading above the 30-SMA, which has not been used as support. If bears get in, we might see price testing this SMA for the first time in the uptrend. If the SMA holds, then bulls will come back in and push the price higher. However, if bulls are still strong, we might see the price hit 135.00.
Looking to trade forex now? Invest at eToro!
68% of retail investor accounts lose money when trading CFDs with this provider. You should consider whether you can afford to take the high risk of losing your money
