- The bias remains bullish, despite temporary retreats.
- The US economic figures should bring high action later.
- After its strong rally, a retreat is favored.
The USD/JPY price climbed as high as 137.74 today, forming a fresh peak. The bias is bullish in the short term. Still, we cannot exclude a minor correction after a strong gain.
–Are you interested in learning more about day trading brokers? Check our detailed guide-
Fundamentally, the Japanese and US economic data came in mixed yesterday. The Japanese Revised Industrial Production rose by 1.1% versus the 0.8% growth estimated, Prelim GDP increased by 0.4%, beating the 0.2% growth forecasted, while Prelim GDP Price Index reported 2.0% growth matching expectations.
On the other hand, the US Housing Starts came in at 1.40M as expected but above 1.37M in the previous reporting period. The Building Permits indicator was reported at 1.42M below the 1.44M estimated.
Today, the Japanese Trade Balance came in better than expected, at -1.02T compared to -1.08T forecasts. Later, the US data could change the short-term sentiment. The unemployment Claims indicator is expected to drop to 253K from 264K. This is seen as a high-impact event. In addition, the CB Leading Index, Existing Home Sales, and Philly Fed Manufacturing Index data will also be released.
Tomorrow, Japan is to release Tertiary Industry Activity, and National Core CPI figures, but the Fed Chair Powell Speaks represents the most important event of the day.
USD/JPY price technical analysis: Below key resistance
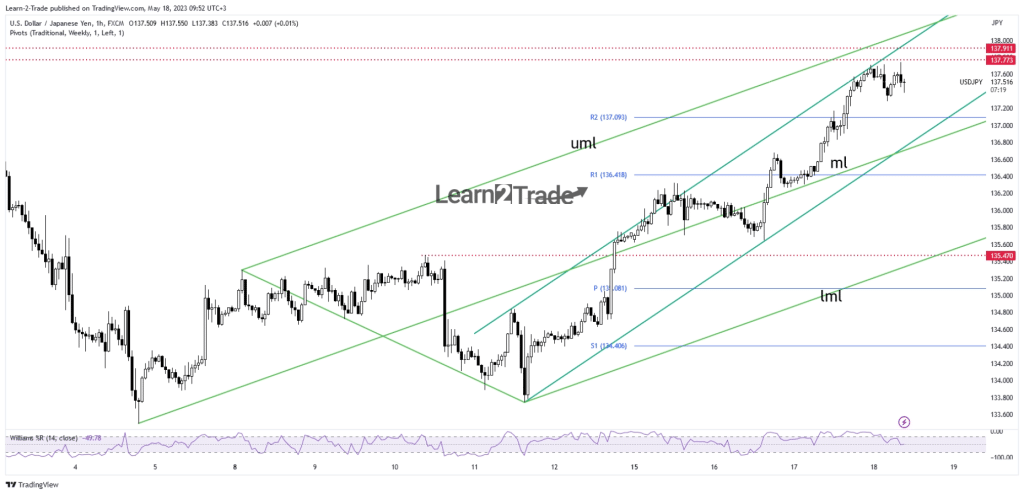
From the technical point of view, the USD/JPY pair registered a strong upwards movement within an up channel inside the ascending pitchfork’s body.
–Are you interested to learn more about low spread forex brokers? Check our detailed guide-
Now, the pair has reached the upside line again. This is dynamic resistance, so a temporary retreat is in the cards. The 137.77 and 137.91 former highs (historical levels) represent major upside targets. After such an impressive rally, a downside correction could be expected.
The price moves somehow sideways on lower time frames. This could be an accumulation. Still, false breakouts through the resistance levels or a new lower low should announce a potential drop at least towards the weekly R2 (137.09) and down to the uptrend line.
Looking to trade forex now? Invest at eToro!
67% of retail investor accounts lose money when trading CFDs with this provider. You should consider whether you can afford to take the high risk of losing your money.
