- The USD/JPY pair invalidated a potential leg higher towards the 111.65 level.
- The false breakout could signal a potential downside breakout.
- 06 is seen as a downside target if the USD/JPY makes a valid breakdown through the uptrend line.
The USD/JPY price plunged in the last hour, and now it stands at 110.03, far below 110.41 today’s high. It may continue to move sideways after invalidating the breakout above major resistance levels. Furthermore, the price drops as the Dollar Index is strongly bearish after the ADP Non-Farm Employment Change release.
–Are you interested to learn more about day trading brokers? Check our detailed guide-
Unfortunately for the USD, the indicator was reported at 374K in August versus 326K in July, far below the 640K jobs expected by the specialists. Finally, the ISM Manufacturing PMI could be decisive today. It’s expected to drop to 58.5 from 59.5 points in August, indicating the expansion slowdown. This is seen as a high-impact indicator, so more negative data today could punish the greenback.
The Final Manufacturing PMI could remain unchanged at 61.2 points in August, while the Construction Spending could rise by 0.2% in July. In addition, the Wards Total Vehicle Sales and the ISM Manufacturing Prices could come in worse compared to the previous reporting period.
USD/JPY price technical analysis: Bearish pattern confirmation
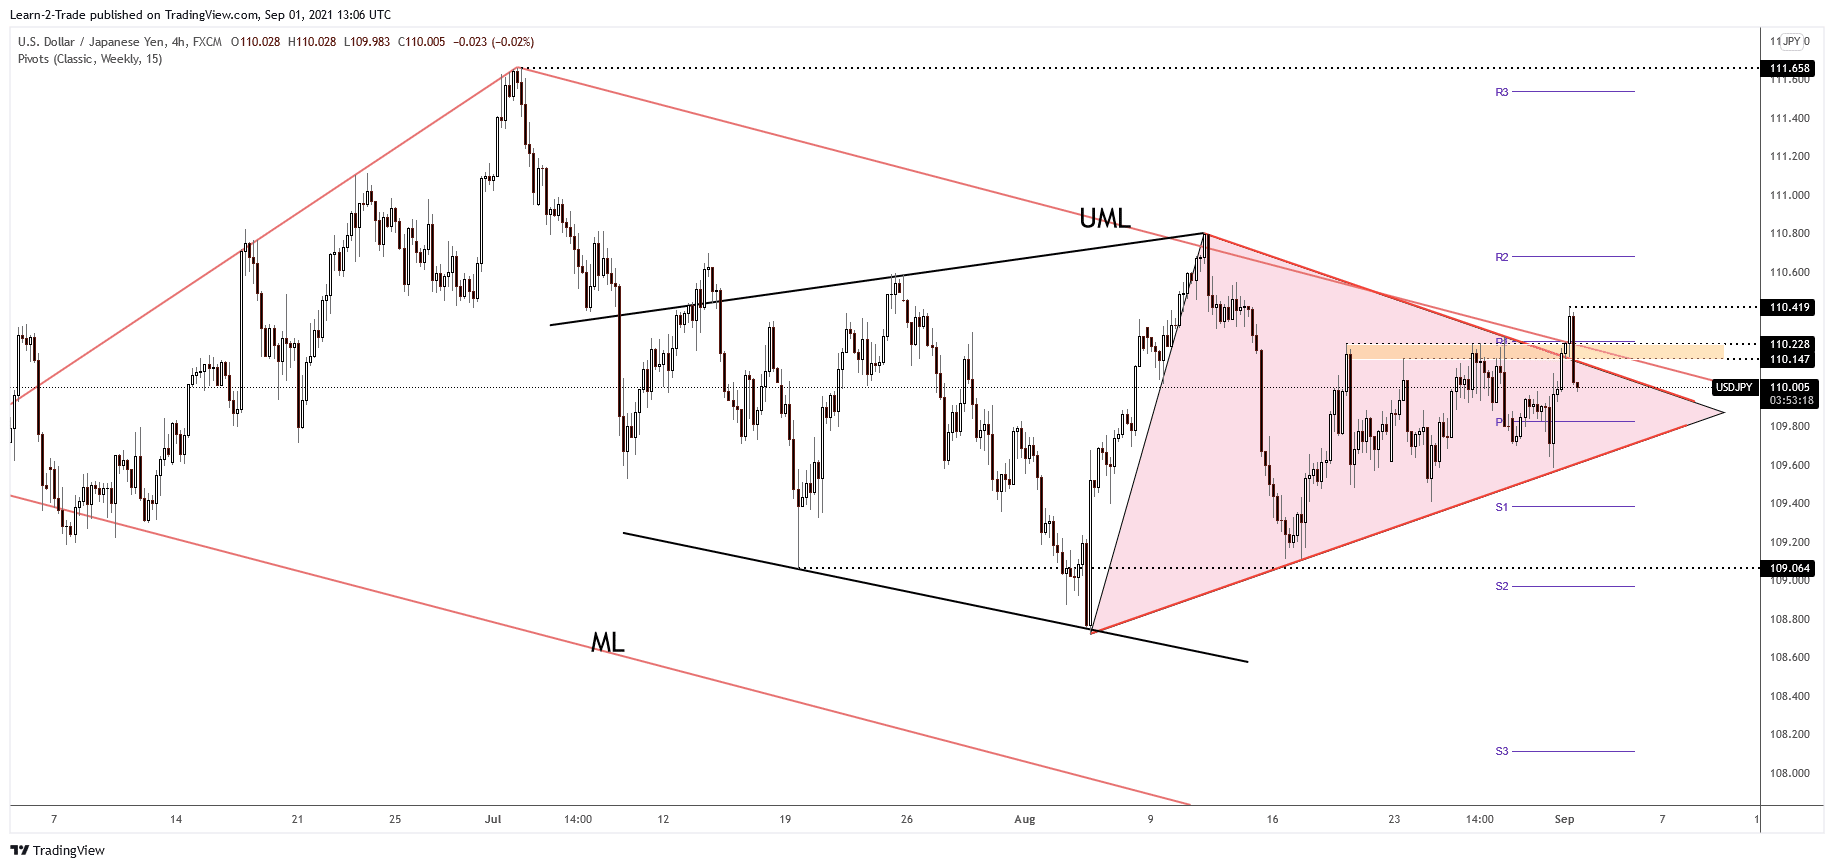
The USD/JPY pair drops like a rock after failing to stabilize above the broken upper median line (UML) of the descending pitchfork. Its failure to stabilize above the weekly R1 (110.24) signals a downside movement until the weekly pivot point (109.82). The current sell-off has invalidated its breakout from the current triangle and above the 110.22 – 110.14 resistance zone. Technically, the false breakdown could signal that the pair may register a downside breakout from the triangle pattern. Dropping and stabilizing below the uptrend line signals a potential broader drop.
–Are you interested to learn more about forex signals? Check our detailed guide-
As you can see on the H4 chart, the USD/JPY pair could extend its sideways movement. 109.06 level is seen as a downside target. Only coming back above the immediate resistance levels could really indicate an upwards movement.
Looking to trade forex now? Invest at eToro!
67% of retail investor accounts lose money when trading CFDs with this provider. You should consider whether you can afford to take the high risk of losing your money.
