- The USD/JPY dropped only because the Dollar Index has plunged in the short term.
- The pair is still trapped within a triangle pattern, so only a breakout may bring new opportunities.
- Its false upside breakout signals a potential breakdown from the current formation.
The USD/JPY price moves sideways, but it may escape from this range soon. The price is very heavy in the short term, so a downside breakout is imminent.
-Are you looking for automated trading? Check our detailed guide-
Still, it remains to see how it will react as the Dollar Index has reached a support zone, a confluence area. Technically, the pair plunged only because the DXY slipped lower after its amazing rally. The Japanese stock index (Nikkei) continues to gain, signaling Yen’s weakness.
Fundamentally, the US dollar was somehow expected to rise in the short term after the Unemployment Claims indicator was reported lower at 310K versus 343K estimates compared to 345K in the previous reporting period. The USD/JPY dropped only because the Dollar Index has turned to the downside. The Japanese Economic Watchers Sentiment, Final GDP Price Index, Current Account, and Bank Lending indicators have disappointed yesterday’s session. Also, today, the Japanese Prelim Machine Tool Orders was reported lower at 86.2% compared to 93.4% expected.
The US Dollar needs strong support from the US economy to be able to rise again. The US PPI and the Core PPI figures could be decisive tomorrow. Better than expected data might boost the DXY, so the USD/JPY pair can start rising again.
USD/JPY price technical analysis: Triangle pattern to lay
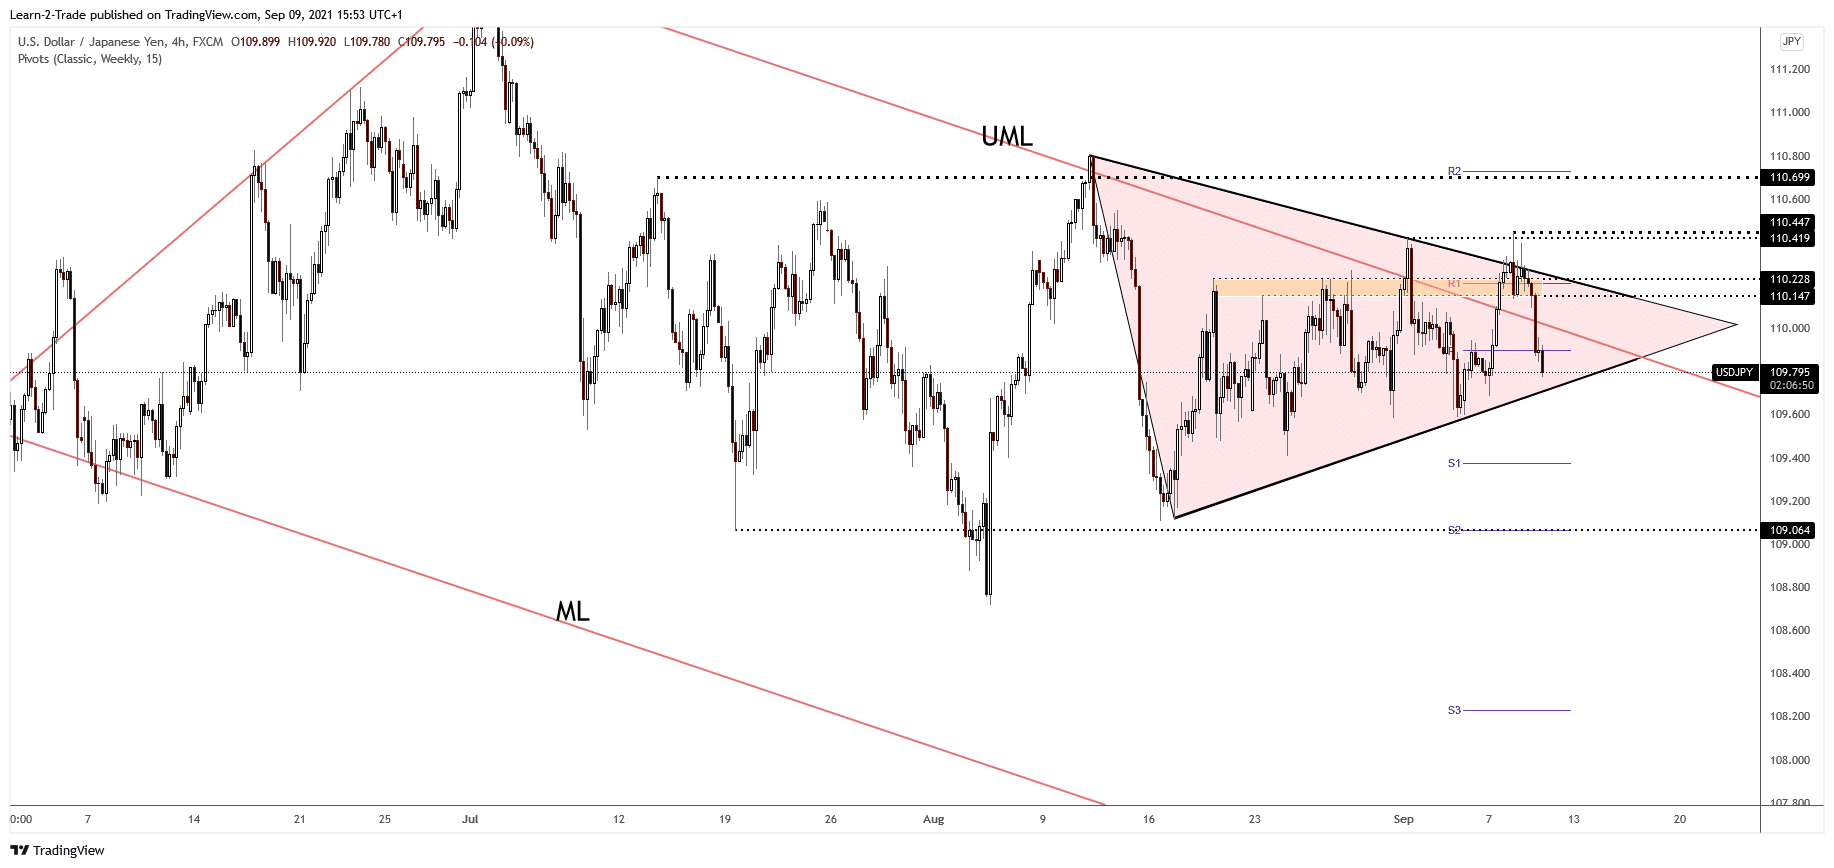
Again, the USD/JPY price failed to stabilize above the descending pitchfork’s upper median line (UML), signaling massive pressure. It has registered a false breakout through 110.41 former high and now is traded lower at 109.78.
-If you are interested in forex day trading then have a read of our guide to getting started-
It’s still trapped within the symmetrical triangle pattern, so we’ll have to wait for a valid breakout before going long or short. Technically speaking, its false breakouts above the triangle’s resistance signaled a potential downside breakout. It remains to see how it will react at the triangle support. A valid breakdown signals a deeper drop. On the other hand, a false breakdown with great separation or a major bullish engulfing trigger an upside momentum.
Looking to trade forex now? Invest at eToro!
75% of retail investor accounts lose money when trading CFDs with this provider. You should consider whether you can afford to take the high risk of losing your money.
