- USD/JPY recovers from three months low amid nearly oversold RSI conditions.
- 23.6% Fibonacci retracement, 200-day SMA add to the resistance.
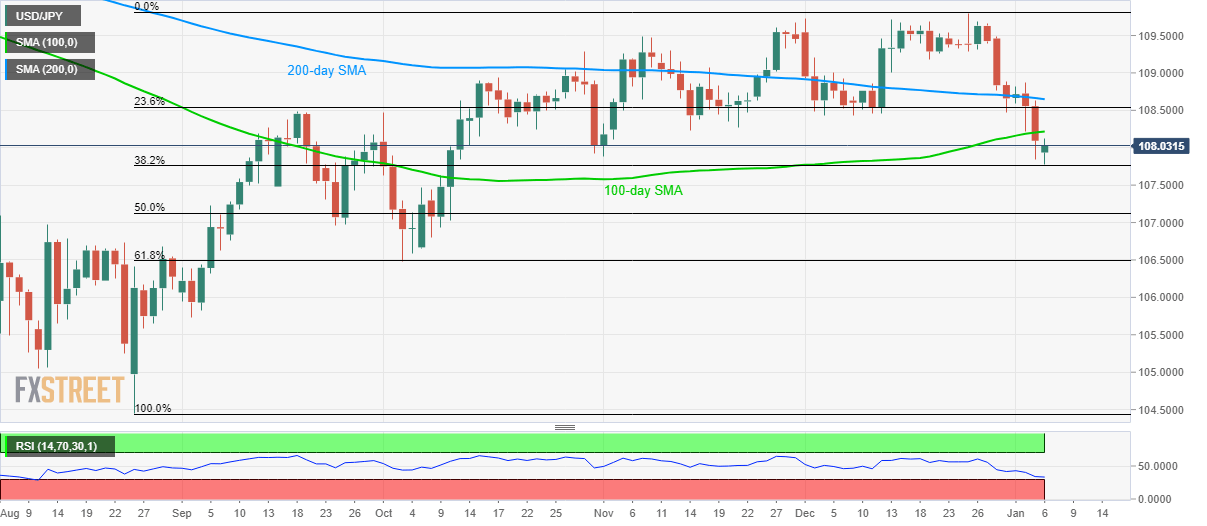
USD/JPY recovers to 108.00 amid the initial trading session on Monday. That said, the pair dropped to the lowest since October 10 during the early Asian session but bounced off 38.2% Fibonacci retracement of August-December 2019 upside amid oversold RSI.
While prices are likely to witness further pullback, a 100-day SMA level of 108.22 will question pair’s run-up towards 23.6% Fibonacci retracement level of 108.55.
Additionally, 200-day SMA around 108.65 could hold the key to pair’s rise targeting a monthly top near 108.90.
Meanwhile, pair’s declines below 38.2% Fibonacci retracement level of 107.75 can please the bears with late-September lows near 107.00.
Though, sellers’ failure to respect oversold RSI by a sustained dominance below 107.00 can recall October month low, also 61.8% Fibonacci retracement, at 106.48 to the chart.
USD/JPY daily chart
Trend: Bearish
