- 7-day old ascending trend-line, 4H 50EMA can question the USD/JPY pair’s latest pullback.
- 108.75/80, 109.00 seem the key upside resistance.
Following its recent decline on the back of overbought RSI levels, the USD/JPY pair trades near 108.50 during early Monday.
Even if 14-bar relative strength index (RSI) is near the overbought conditions, an upward sloping trend-line stretched since July 18 and 50-bar exponential moving average on the 4-hour chart (4H 50EMA), around 108.30/25, seems to be a tough nut to crack for sellers.
Given the price dip below 108.25, 107.80 and 107.55 may offer intermediate halts to the monthly low close near 107.20.
In a case where the quote takes a U-turn, it needs to successfully cross 108.75/80 regions in order to aim for the latest high surrounding 109.00.
USD/JPY 4-hour chart
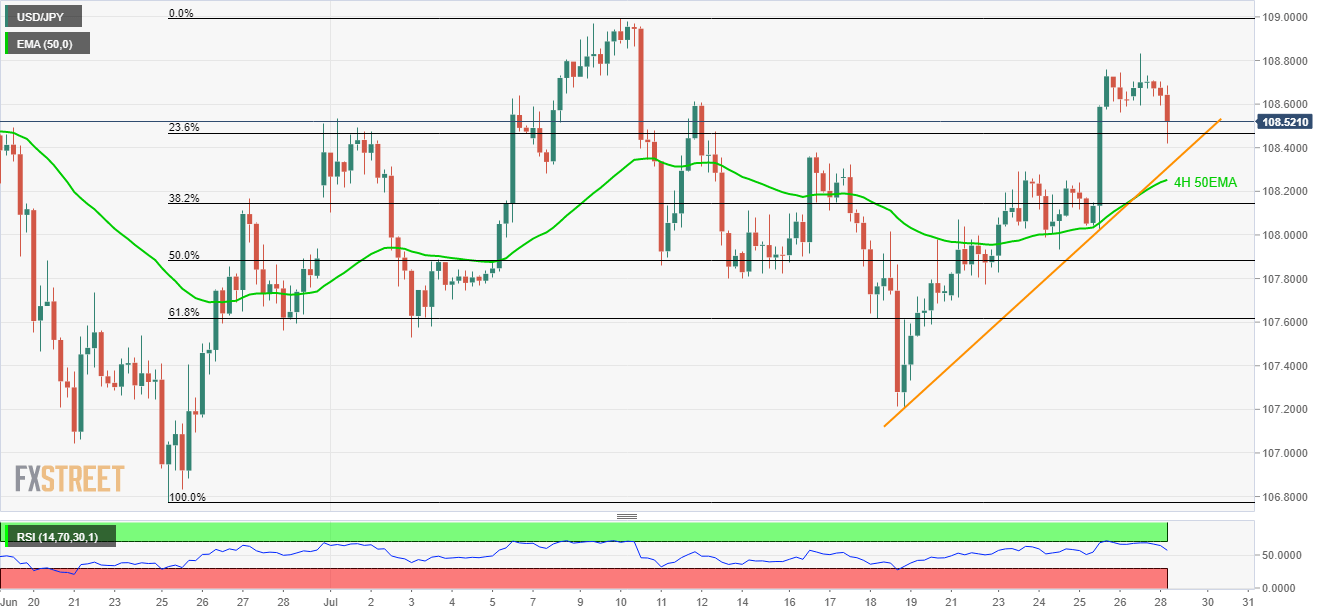
Trend: Bullish
