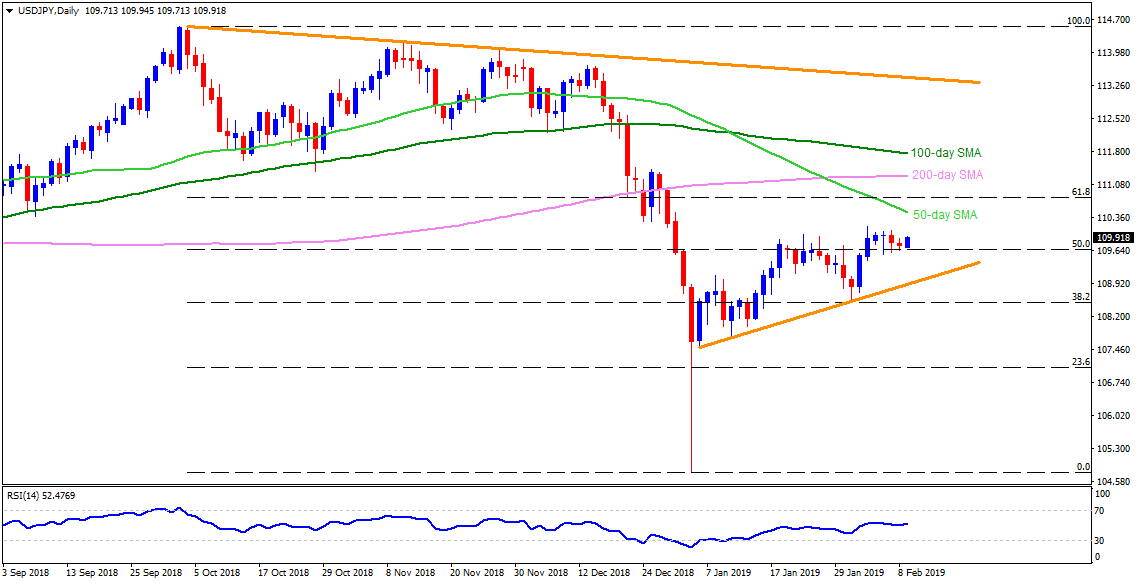
USD/JPY daily chart The USD/JPY pair trades positively towards confronting 110.00 at the initial hours of Asian sessions on Monday. The round-figure has recently confined the pair’s upside multiple times and a break of which could trigger an upside targeting 110.30 and 50-day simple moving average (SMA) level of 110.50. During the pair’s successful rise past-110.50, the 200-day SMA level of 111.25 and 111.80 including 100-day SMA can please the buyers. On the downside, 50% Fibnacci Retracement of its October-January decline, at 109.60, becomes immediate support for the pair, breaking which 109.10 may gain market attention. Additionally pair’s drop under 109.10 can highlight the importance of an upward sloping trend-line, at 108.85. 
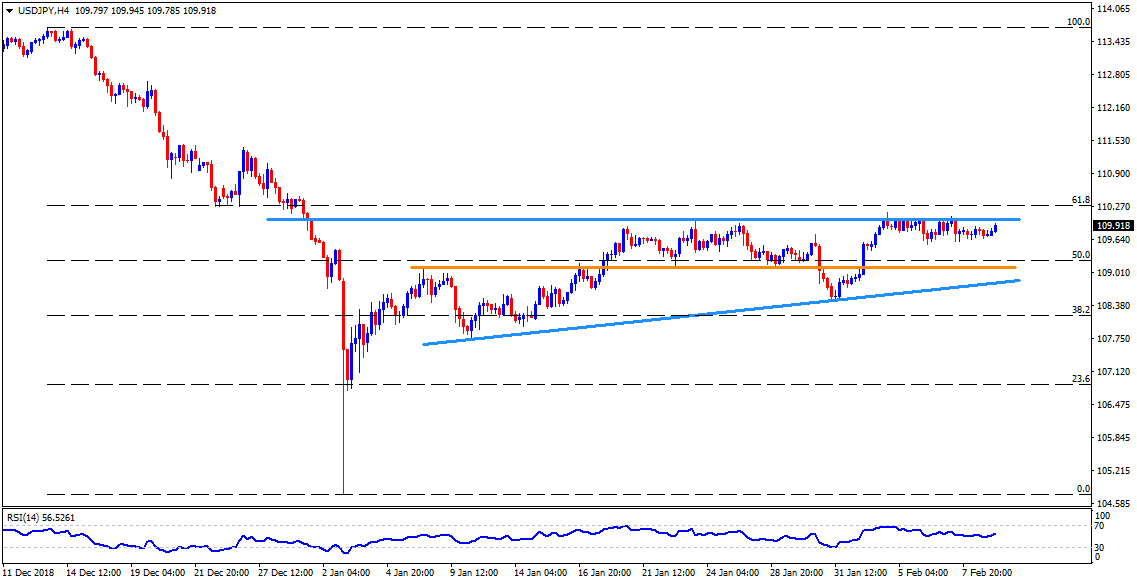
USD/JPY 4-Hour chart The H4 chart magnifies the importance of 110.00 horizontal resistance with 61.8% Fibonacci Retracement of its December – January slump, at 110.30, being following upside level to watch before targeting 110.50. Meanwhile, 109.60 and the 109.10 can keep limiting nearby downside of the pair, a break of which can challenge sellers with an upward sloping support-line of 108.85. 
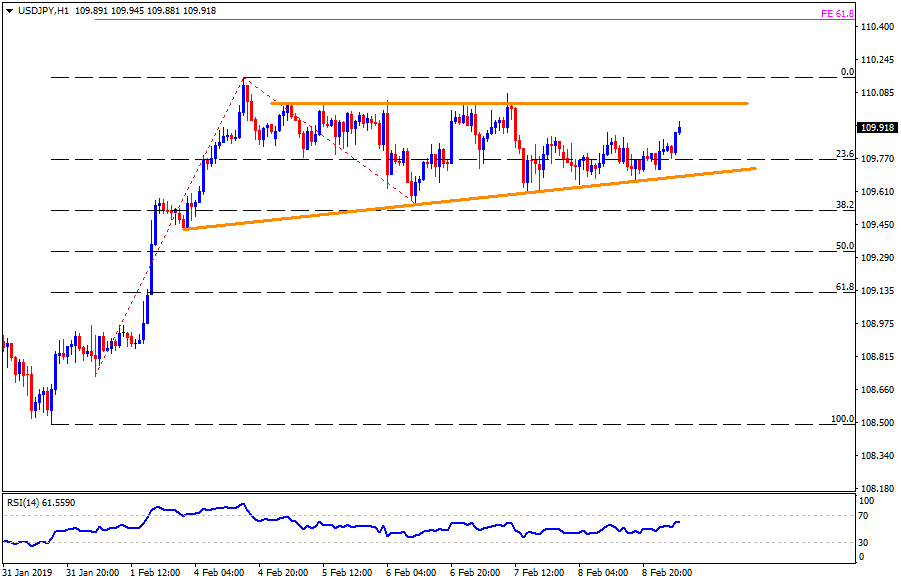
USD/JPY hourly chart On the hourly chart, 110.15 may act as intermediate halt during the pair’s rise after 110.00 and before 61.8% Fibonacci expansion of its recent upside, at 110.45. Alternatively, 109.40 may offer as a buffer stop past-109.60 support-line break. FX Street FX Street FXStreet is the leading independent portal dedicated to the Foreign Exchange (Forex) market. It was launched in 2000 and the portal has always been proud of their unyielding commitment to provide objective and unbiased information, to enable their users to take better and more confident decisions. View All Post By FX Street FXStreet News share Read Next HIBOR rate hits lowest since June 2017 – Reuters FX Street 3 years USD/JPY daily chart The USD/JPY pair trades positively towards confronting 110.00 at the initial hours of Asian sessions on Monday. The round-figure has recently confined the pair's upside multiple times and a break of which could trigger an upside targeting 110.30 and 50-day simple moving average (SMA) level of 110.50. During the pair's successful rise past-110.50, the 200-day SMA level of 111.25 and 111.80 including 100-day SMA can please the buyers. On the downside, 50% Fibnacci Retracement of its October-January decline, at 109.60, becomes immediate support for the pair, breaking which 109.10 may gain market attention. Additionally pair's drop under… Regulated Forex Brokers All Brokers Sponsored Brokers Broker Benefits Min Deposit Score Visit Broker 1 $100T&Cs Apply 0% Commission and No stamp DutyRegulated by US,UK & International StockCopy Successfull Traders 9.8 Visit Site FreeBets Reviews$100Your capital is at risk. 2 T&Cs Apply 9.8 Visit Site FreeBets Reviews$100Your capital is at risk. 3 Recommended Broker $100T&Cs Apply No deposit or withdrawal feesTrade major forex pairs such as EUR/USD with leverage up to 30:1 and tight spreads of 0.9 pips Low $100 minimum deposit to open a trading account 9 Visit Site FreeBets ReviewsYour capital is at risk. 4 T&Cs Apply Visit Site FreeBets ReviewsYour capital is at risk. 5 Recommended Broker $0T&Cs Apply Trade gold, silver, and platinum directly against major currenciesUp to 1:500 leverage for forex trading24/5 customer service by phone and email 9 Visit Site FreeBets ReviewsYour capital is at risk.