- 14-week old support-turned-resistance acts as an immediate upside barrier.
- 109.80/75 seems strong support with 110.30 being an intermediate halt during the decline.
Despite recently bouncing off 110.30, the USD/JPY still remains under 14-week long support-line (now resistance) as it trades near 110.80 while heading into the European session on Monday.
With the failure to slip much beneath 100-day simple moving average (SMA), the pair is likely witnessing pullback to regain Friday levels provided it manages to rise past-110.80/85 trend-line.
Should that happen, prices can rise to 111.00 and 111.30 but 200-day SMA level at 111.55 may limit further advances.
In a case where the quote rallies beyond 111.55, the 112.10/20 region comprising multiple highs since early March could please buyers.
Alternatively, the 109.80/75 support-zone including lows since February 11 could offer strong near-term support. Though, 110.30 may act as immediate rest for the pair.
Given the bears keep ruling past-109.75, 38.2% Fibonacci retracement of its January – April upside near 109.50, followed by 109.00, can flash on the chart.
USD/JPY daily chart
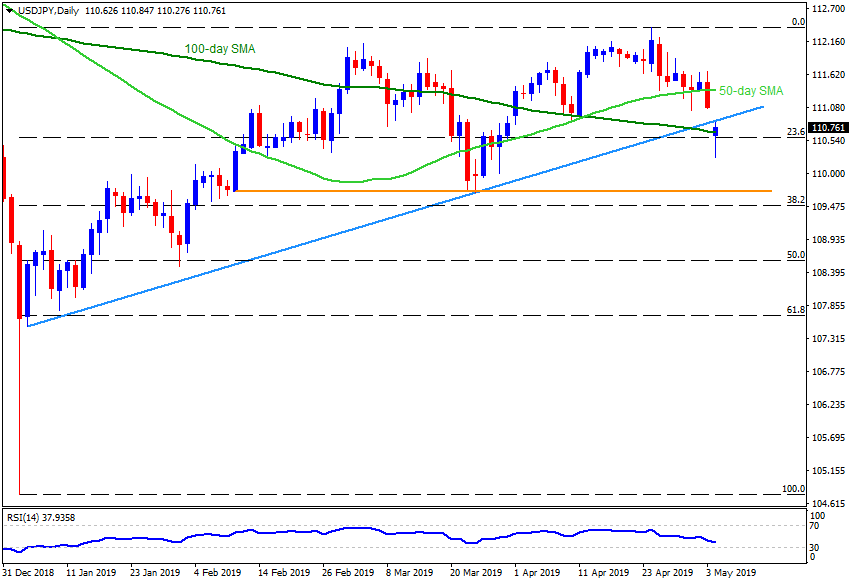
Trend: Pullback expected
