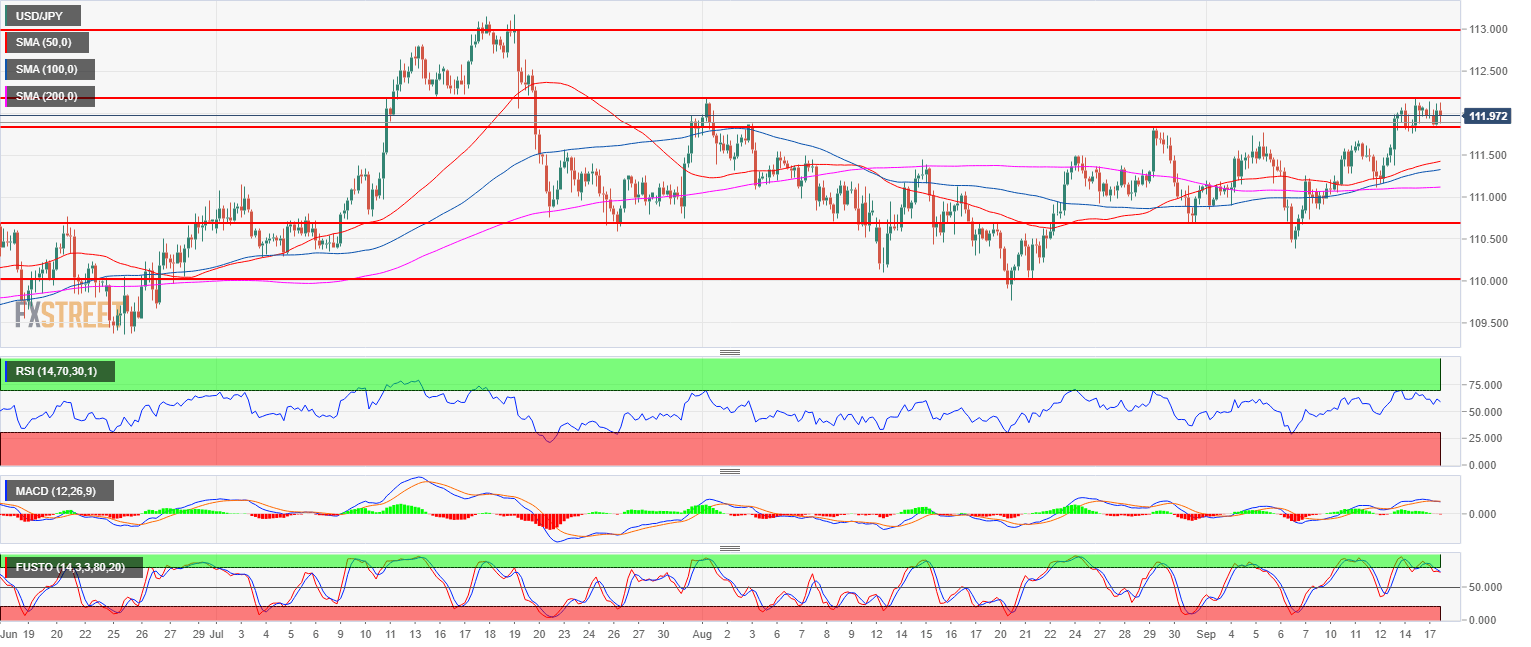
- USD/JPY main bull trend is on hold.
- USD/JPY is facing resistance at the 112.17 level (August 1, swing high) as the RSI, MACD and Stochastics indicators are decelerating. A failure to break above 112.17 should lead to a rotation down towards 111.54 (August 6, high) and 111.00 figure.
- A sustained bull breakout above 112.17 would invalidate the short-term bearish bias.
Spot rate: 111.97
Relative change: -0.09%
High: 112.14
Low: 111.85
Main trend: Bullish
Short-term trend: Bearish below 112.17
Resistance 1: 112.00-112.17 zone, figure and August 1, swing high
Resistance 2: 112.50 figure
Resistance 3: 113.18, 2018 high
Support 1: 111.84 August 29 swing high
Support 2: 111.84 August 29 swing high
Support 3: 111.54 August 6, high
Support 4: 111.45 August 8 high
Support 5: 111.00 figure
Support 6: 110.75, July 23 swing low
Support 7: 110.00 figure
Support 8: 109.37 June 25 low
