- USD/JPY has stabilised to form what could be the making of a W-Bottom pattern.
- A break of 109.10 opens the Bollinger band W-Bottom break up point.
- Bulls can target the 21-D SMA at 109.76.
- Should 108.60 give out, the trend stays bearish and opens the 100-D SMA/50-D SMA convergence at 108.20.
USD/JPY 1-hr chart
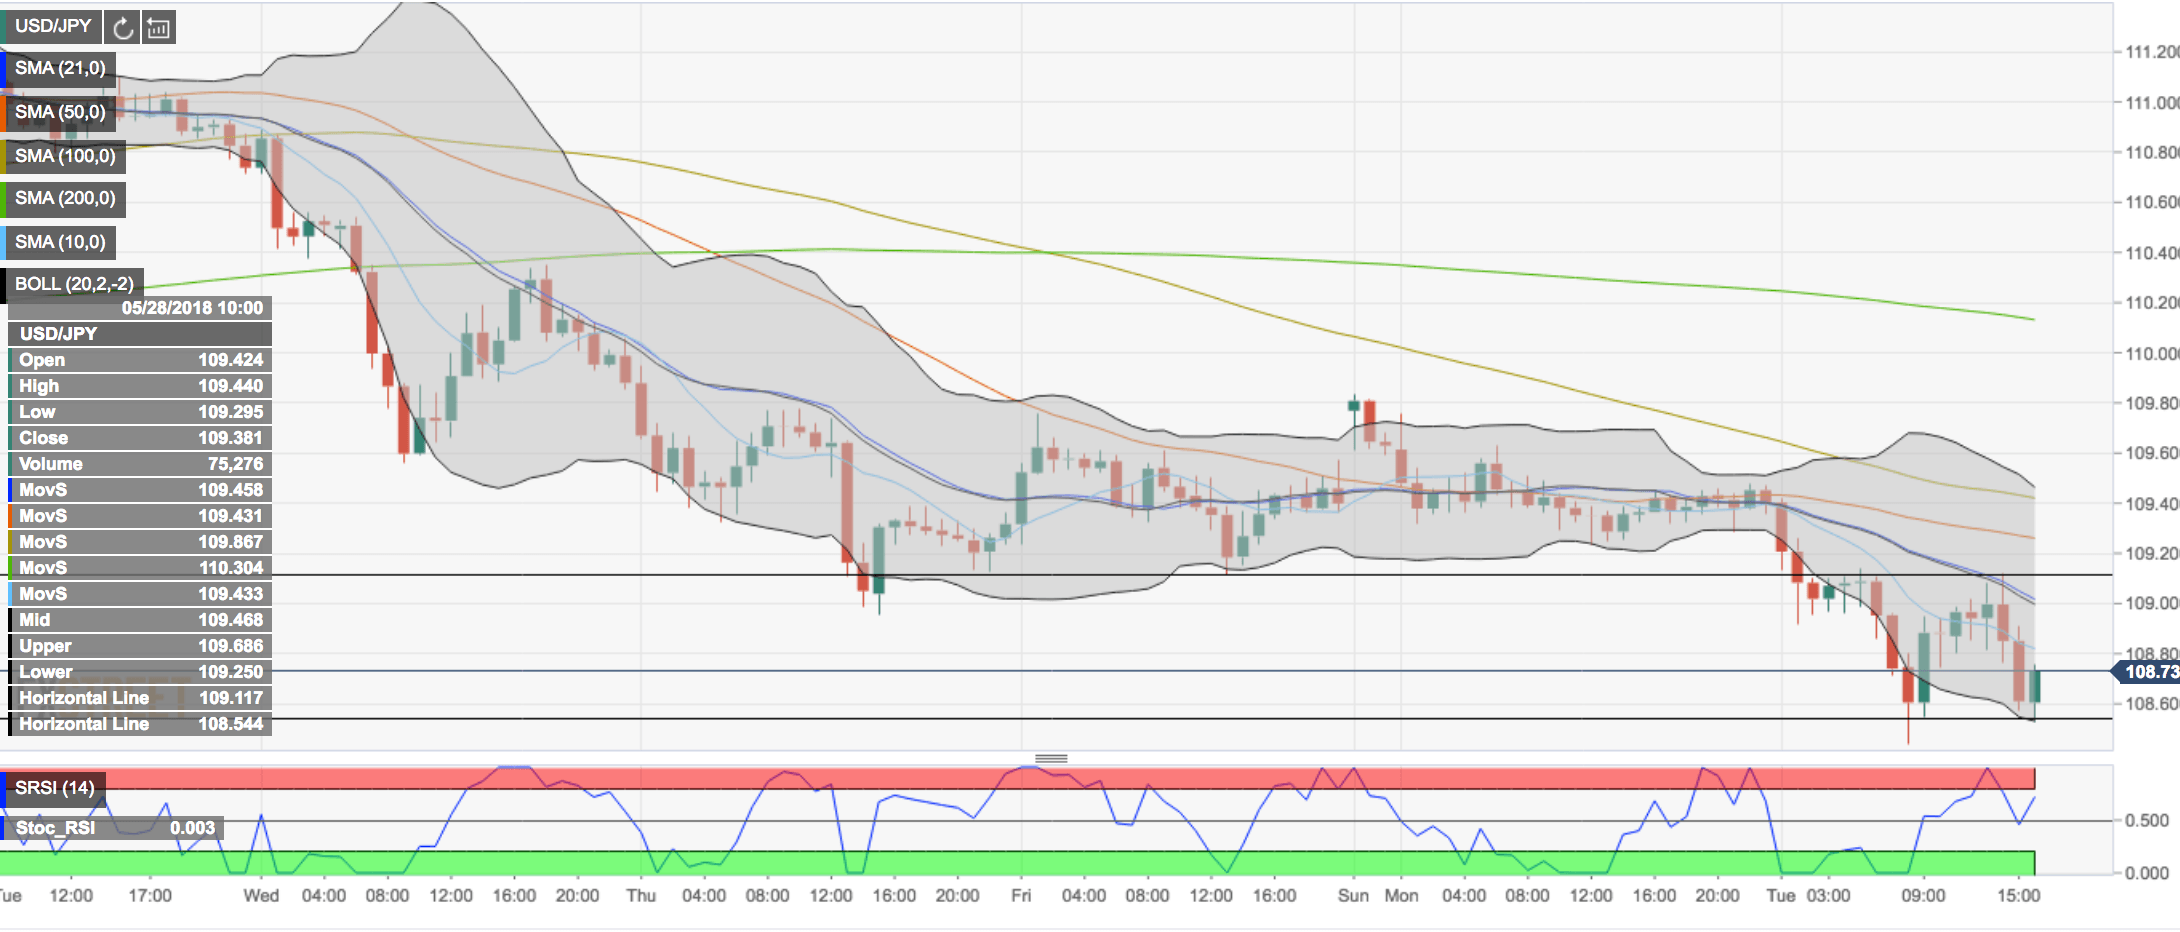
Spot rate: 108.73
Relative change: -0.63%
High: 109.44
Low: 109.29
Trend: Bearish
Support 1: 108.55/60 BB and PP support.
Support 2: 108.18 PP 1M, 100-D SMA meets 50-D SMA.
Support 3: 106.82 S1 1M
Resistance 1: 109.10 BB WB break up point.
Resistance 2: 109.76/92 21-D SMA / PP-1W
Resistance 3: 110.89 R1-1W
