- USD/JPY stays below the two-month-old rising trend line but fails to extend weakness under 200-day SMA.
- Multiple highs marked in December restrict near-term upside.
USD/JPY remains under pressure while trading around 108.70 during early Thursday. The pair recently slipped beneath an upward sloping trend line since early-November but failed to conquer 200-day SMA. Additionally, 14-bar RSI is also in the normal condition and indicates the continuation of sideways momentum.
An upside clearance of 108.80 support-turned-resistance can trigger the fresh recovery of the pair toward December 19 low of 109.20 whereas sustained trading below 200-day SMA, at 108.67 now, can take aim at December month low near 108.43.
It should, however, be noted that the pair’s trading past-108.43 can test lows marked on October 11 and November 01, around 107.80.
On the contrary, 109.70/80 region including multiple highs marked in December, followed by 110.00, restricts the pair’s rise past-109.20.
USD/JPY daily chart
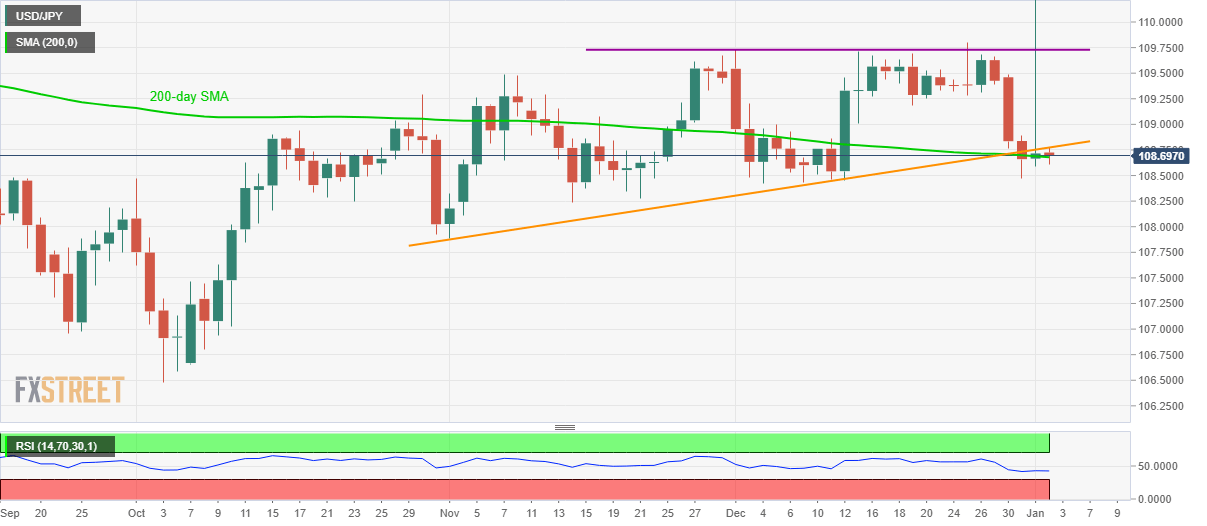
Trend: Sideways
