- Break of short-term descending trend-line favors advances if buyers clear 21-day SMA.
- Immediate upward sloping support-line can limit the declines.
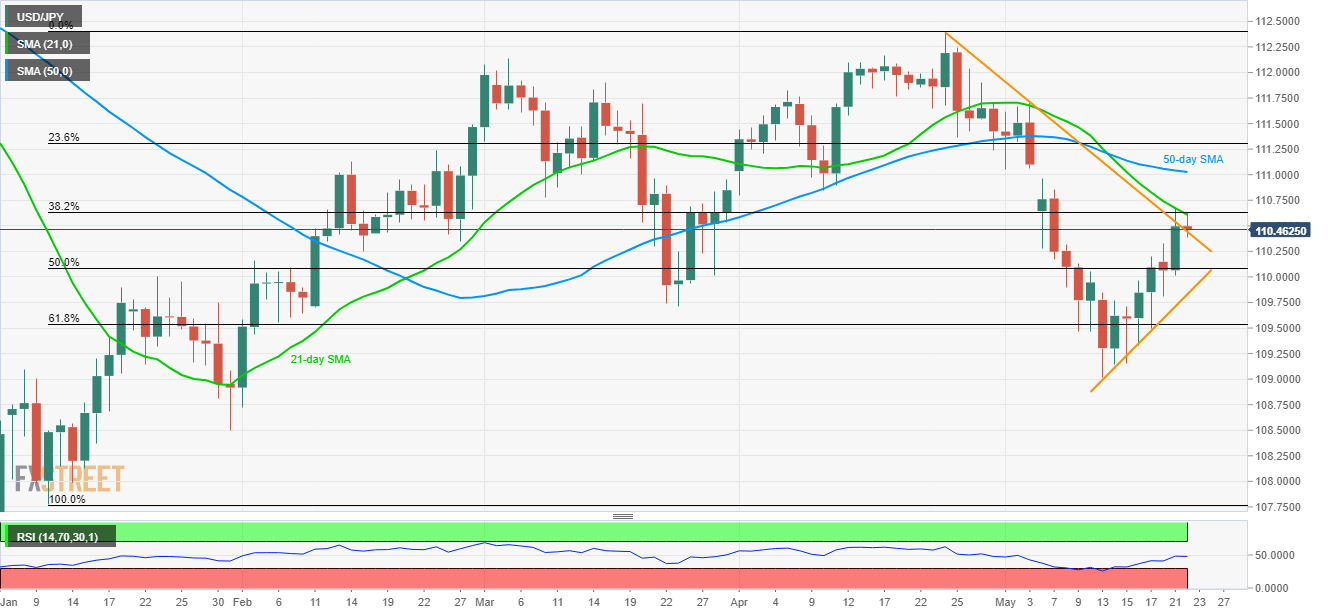
Despite breaking four-week-old trend-line resistance, the USD/JPY pair couldn’t cross 21-day simple moving average (SMA) as it slips beneath 110.50 ahead of the European session on Wednesday.
With this, prices are likely to revisit 110.30 and 50% Fibonacci retracement of January 10 to April 24 upside, at 110.10. However, an ascending trend-line stretched since May 13 may limit the pair’s further declines at 109.80/75.
In a case where sellers dominate market sentiment, 61.8% Fibonacci retracement around 109.55 and current month lows near 109.00 could become their favorites.
Alternatively, a successful break of 110.65 comprising 21-day SMA could further escalate the pair’s rise towards 50-day SMA level of 111.00.
Also, pair’s extended north-run past-111.00 can avail 111.70 and 112.20 as intermediate halts ahead of highlighting April highs adjacent to 112.40.
USD/JPY daily chart
Trend: Pullback expected
