- USD/JPY drops to the eight-day low amid the on-going rush to risk-safety.
- Multiple resistances, bearish MACD keep buyers away.
Escalating protests in Hong Kong and uncertainty surrounding the US-China trade deal exert downside pressure on the USD/JPY pair as it drops to multi-day low while trading near 108.70 ahead of Thursday’s European session.
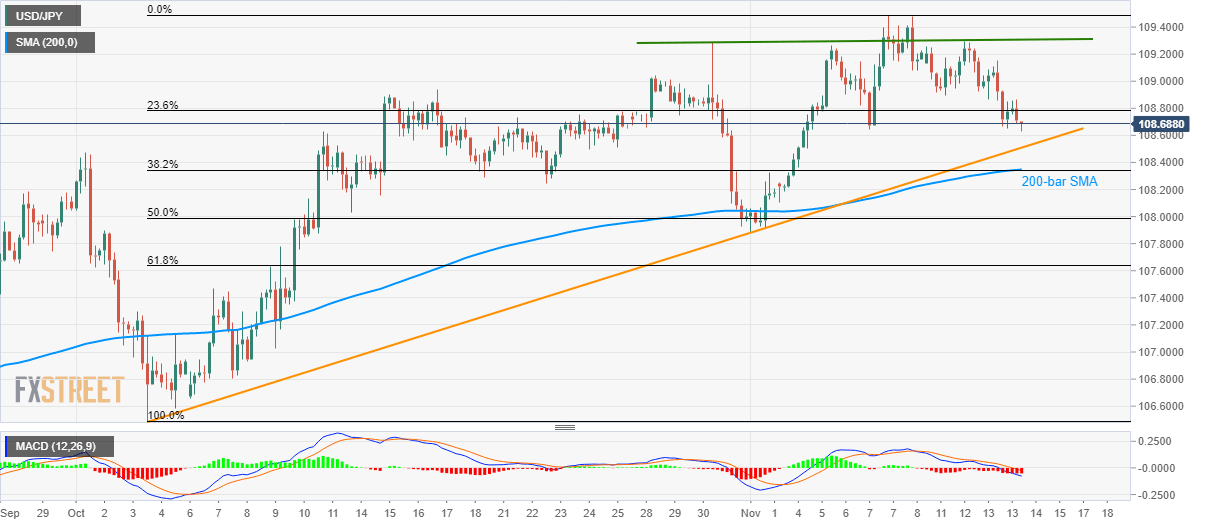
With the bearish signal from 12-bar Moving Average Convergence and Divergence (MACD), the quote is declining further towards the six-week-old rising support line, at 108.50 now. However, 108.30 confluence including 200-bar Simple Moving Average (SMA) and 38.2% Fibonacci retracement of October-November upside will challenge sellers afterward.
Given the bears’ dominance past-108.30, the monthly bottom close to 108.00 and 61.8% Fibonacci retracement level surrounding 107.60 could come back on the chart.
Alternatively, 109.00 acts as an immediate upside barrier for the pair while a break of which could shift buyer’s attention to a horizontal line around 109.30 and then to monthly top adjacent to 109.50.
During the quote’s run-up beyond 109.50, late-May tops near 110.00 and 110.70 could become bull’s favorites.
USD/JPY 4-hour chart
Trend: Bearish
