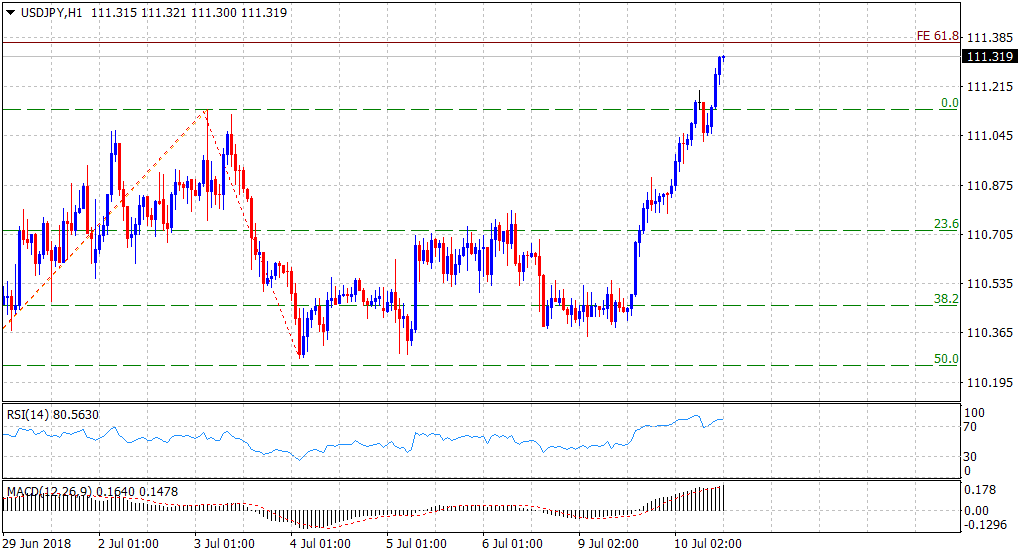
“¢ Resurgent USD demand/fading safe-haven demand helps build on overnight strong gains and continue with the bullish momentum further beyond the 111.00 handle.
“¢ A move beyond early July highs, around the 111.15 zone, was key for buyers and could be attributed to the latest leg of a sharp spike over the past few hours.
“¢ Bulls now eye a decisive move beyond May swing high resistance, near the 111.40 region, also coinciding with 61.8% Fibonacci expansion level of the 109.37-111.14 up-move and subsequent retracement.
Spot rate: 111.32
Daily Low: 110.78
Trend: Bullish
Resistance
R1: 111.63 (R3 daily pivot-point)
R2: 112.00 (round figure mark)
R3: 112.26 (horizontal zone)
Support
S1: 111.00 (previous strong resistance)
S2: 110.78 (current day swing low)
S3: 110.49 (S1 daily pivot-point)
