“¢ The pair finally broke down of its Asian/European session consolidative trading range and has now eroded a major part of overnight strong gains after weaker than expected US PPI figures.
“¢ The pair is now all set to snap three consecutive days of winning streak and the downward momentum could extend towards important moving averages (200 & 100-hour SMA) confluence support.
“¢ The mentioned region also coincides with 38.2% Fibonacci retracement level of the 110.38-111.65 up-move and should act as a key trigger for bearish traders/any further downfall.
“¢ Technical indicators on the 1-hourly chart have also drifted into bearish territory and thus, reinforce prospects for a follow-through weakness on the back of some fresh technical selling.
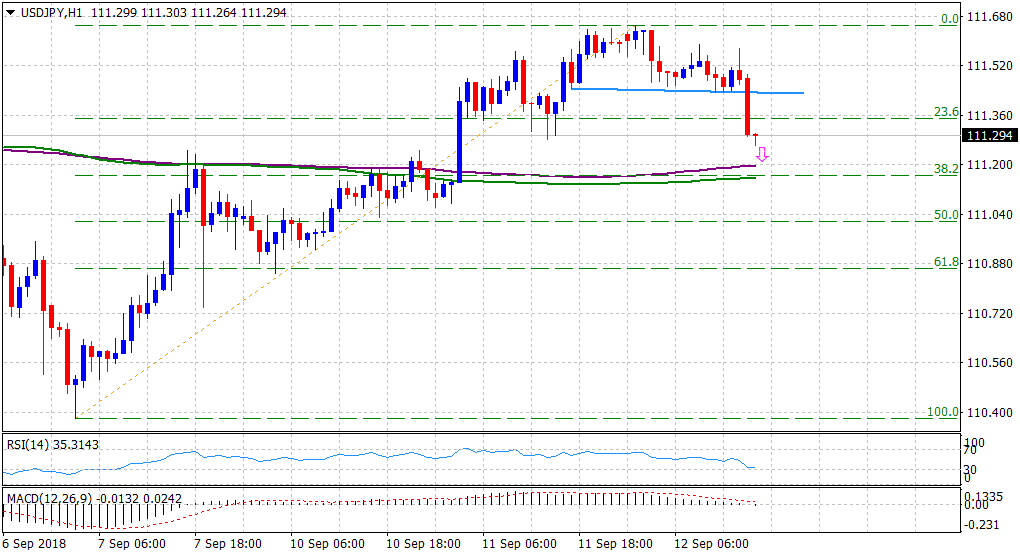
Spot Rate: 111.29
Daily High: 111.65
Trend: Turning bearish
Resistance
R1: 111.45 (horizontal support break-point)
R2: 111.65 (1-week tops set earlier today)
R3: 112.06 (R2 daily pivot-point)
Support
S1: 111.16 (100-period SMA H1)
S2: 110.85 (weekly low set on Monday)
S3: 110.64 (S3 daily pivot-point)
