- One week old trend-line and the RSI pullback restricts immediate upside.
- Multiple supports on the downside can question sellers.
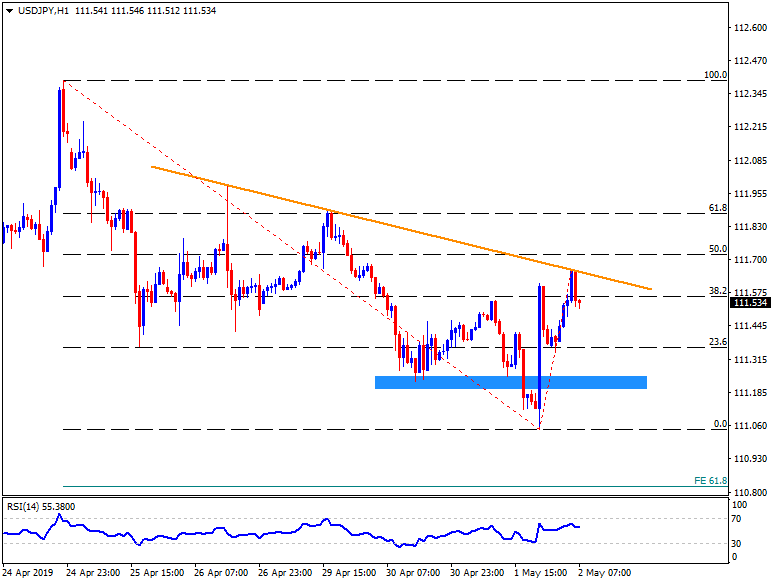
Failure to cross a week-long descending trend-line recently dragged the USD/JPY pair to 111.55 while heading into the European session on Thursday.
With the 14-bar relative strength index (RSI) joining the downtick in prices, 111.35 seems an intermediate halt during the decline towards 111.25/20 support-area.
Though, pair’s sustained downturn past-111.20 might not refrain from revisiting 111.00 and 61.8% Fibonacci expansion (FE) level near 110.80.
In case the quote rallies beyond 111.70 resistance-line, 61.8% Fibonacci retracement level of latest downturn, at 111.90, may quickly acquire buying bets.
Moreover, 112.10 and 112.40/45 might become bull’s favorites above 111.90.
USD/JPY hourly chart
Trend: Down
