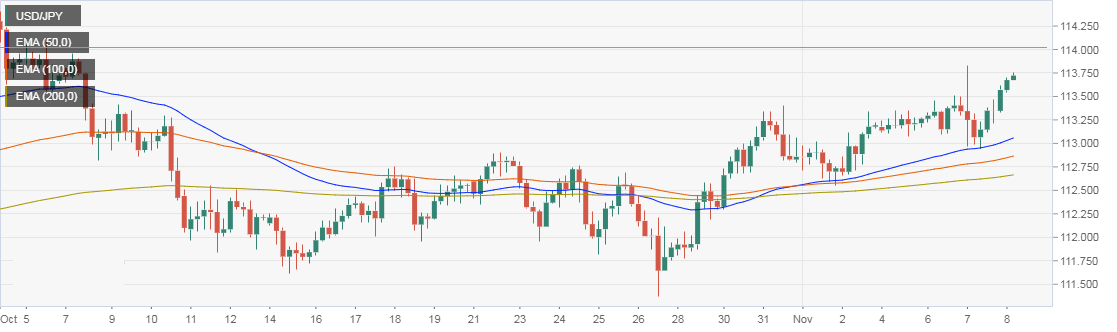
- The USD/JPY has charted a bullish higher lows and higher highs pattern on the 4-hour chart over the last two weeks.
- Notably, the pair created a third higher low yesterday at the ascending 50-period EMA.
- The major EMAs – 50, 100, and 200 – are trending north indicating a bullish setup.
- What bulls need now is a convincing move above 113.82. A break above that levels, if confirmed, would confirm another higher high and bolster the already bullish setup, opening the doors to re-tets of recent highs above 114.50.
4-hour Chart
Trend: Bullish
USD/JPY
Overview:
Last Price: 113.71
Daily change: 19 pips
Daily change: 0.167%
Daily Open: 113.52
Trends:
Daily SMA20: 112.61
Daily SMA50: 112.47
Daily SMA100: 111.79
Daily SMA200: 109.99
Levels:
Daily High: 113.83
Daily Low: 112.94
Weekly High: 113.4
Weekly Low: 111.78
Monthly High: 114.56
Monthly Low: 111.38
Daily Fibonacci 38.2%: 113.49
Daily Fibonacci 61.8%: 113.28
Daily Pivot Point S1: 113.04
Daily Pivot Point S2: 112.55
Daily Pivot Point S3: 112.15
Daily Pivot Point R1: 113.92
Daily Pivot Point R2: 114.32
Daily Pivot Point R3: 114.81
