“¢ Finally breaks below a symmetrical triangular formation on the short-term chart and drops to test the lower end of a two-week-old trading range.
“¢ With short-term technical indicators gradually drifting into bearish territory, weakness below 50-day SMA support suggests further downside in the near-term.
“¢ Only a sustained move back above the very important 200-day SMA barrier might negate the anticipated bearish outlook.
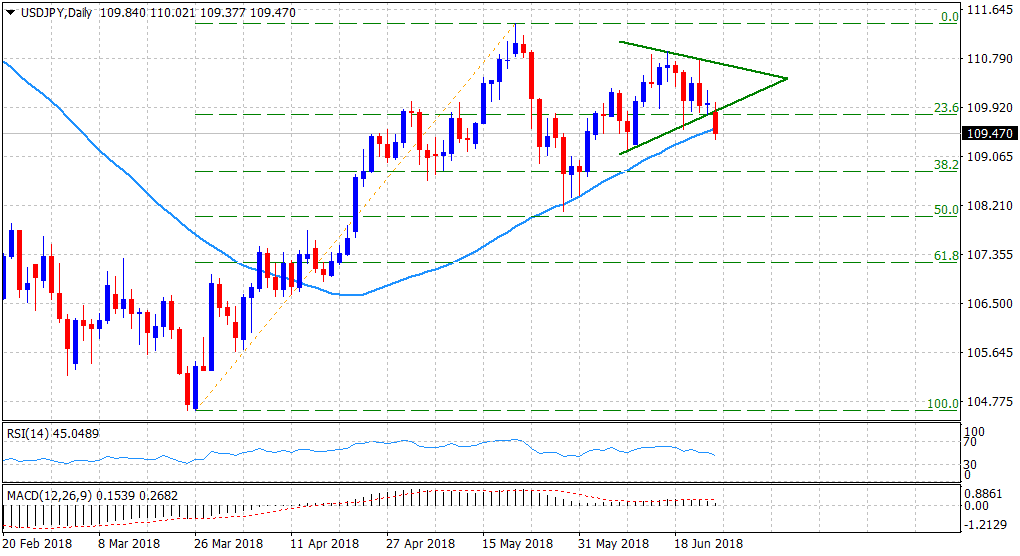
Spot Rate: 109.47
Daily Low: 109.38
Daily High: 110.02
Trend: Bearish
Resistance
R1: 110.02 (current day high)
R2: 110.26 (200-day SMA)
R3: 110.44 (R2 daily pivot-point)
Support
S1: 109.20 (June 8 swing low)
S2: 109.00 (round figure mark)
S3: 108.21 (100-day SMA)
