- USD/JPY broke to the upside after 6 days of consolidation.
- USD/JPY reached the 111.80 resistance and the market is currently consolidating just above the level.
- USD/JPY bullish momentum is back in place with the gap between the simple moving averages widening. However, as USD/JPY has exceeded its average daily range, any further gains might be limited. The next scaling point to the upside is seen near 112.19-112.40 area while support is seen near 110.58 and 111.39 May 21 swing high.
USD/JPY 15-minute chart
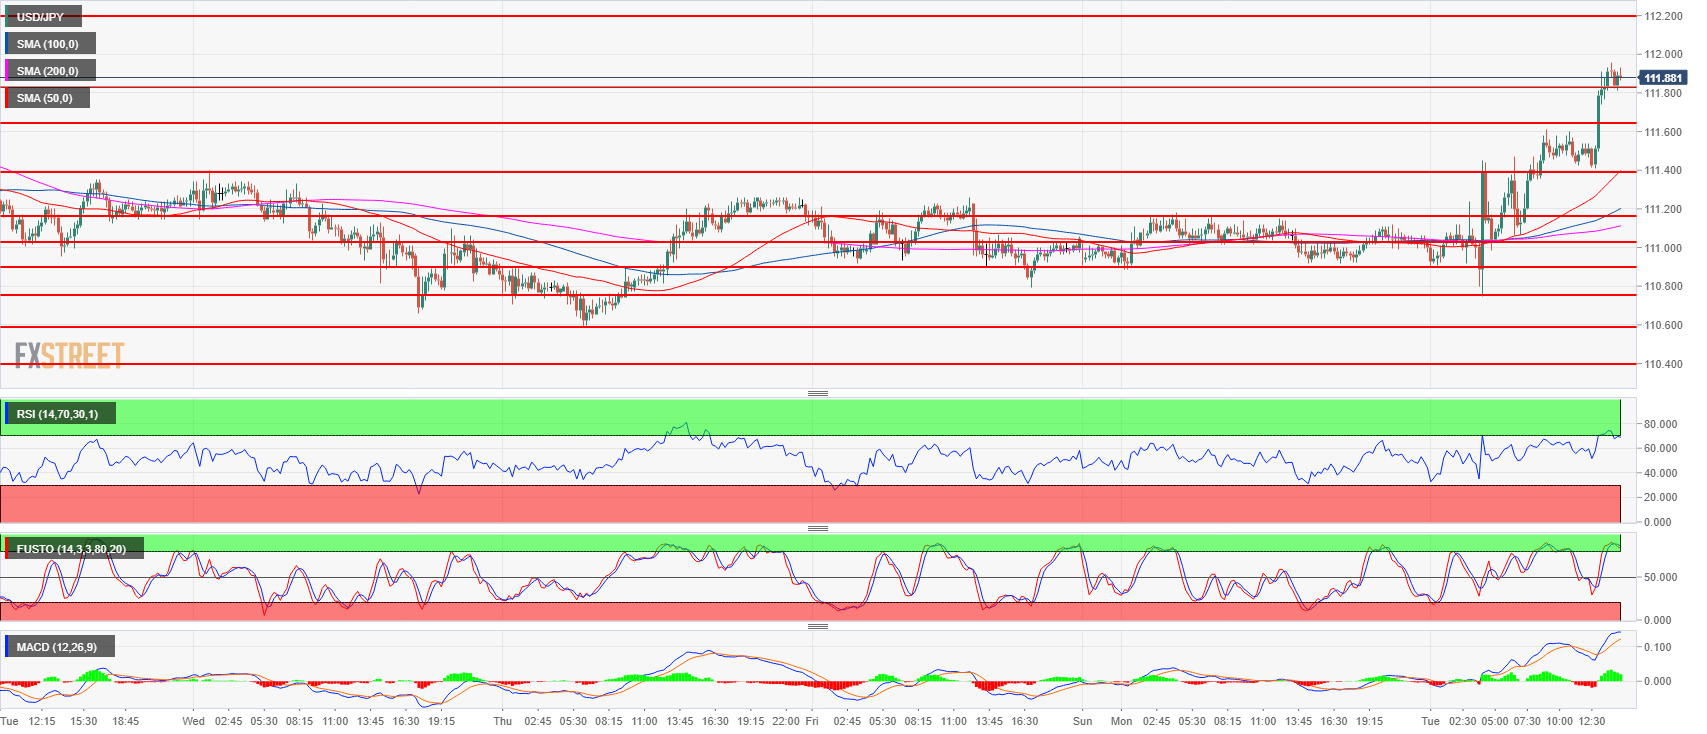
Spot rate: 111.89
Relative change: 0.74%
High: 111.96
Low: 110.74
Trend: Bullish
Resistance 1: 112.19-112.40 area, July 11 high and intraday swing low
Resistance 2: 112.64 July 12 high
Resistance 3: 113.18, 2018 high
Resistance 4: 113.26-113.38, 200-weekly simple moving average and January 8 high
Resistance 5: 114.45 October 27, 2017 high
Support 1: 111.39 May 21 swing high
Support 2: 111.02-111.16 previous intraday swing lows
Support 3: 110.90 June 15 swing high
Support 4: 110.75, July 23 low
Support 5: 110.58 July 26 low
Support 6: 110.27 July 4 low
