- The USD/JPY pair closed well below the crucial 100-day moving average (MA) support, confirming a bullish-to-bearish trend change.
- The long-term average had caught lows on a closing basis in May, August, September, and October. The average also worked as strong support earlier this month.
- The bears, therefore, could be feeling emboldened, having breached the 100-day MA. Simply put, the break below the key average marks an end of the rally from the March low of 104.63.
- The pair could soon explore levels below the psychological support of 110.00. The bearish outlook would be invalidated if and when the 100-day MA hurdle is scaled.
Daily Chart
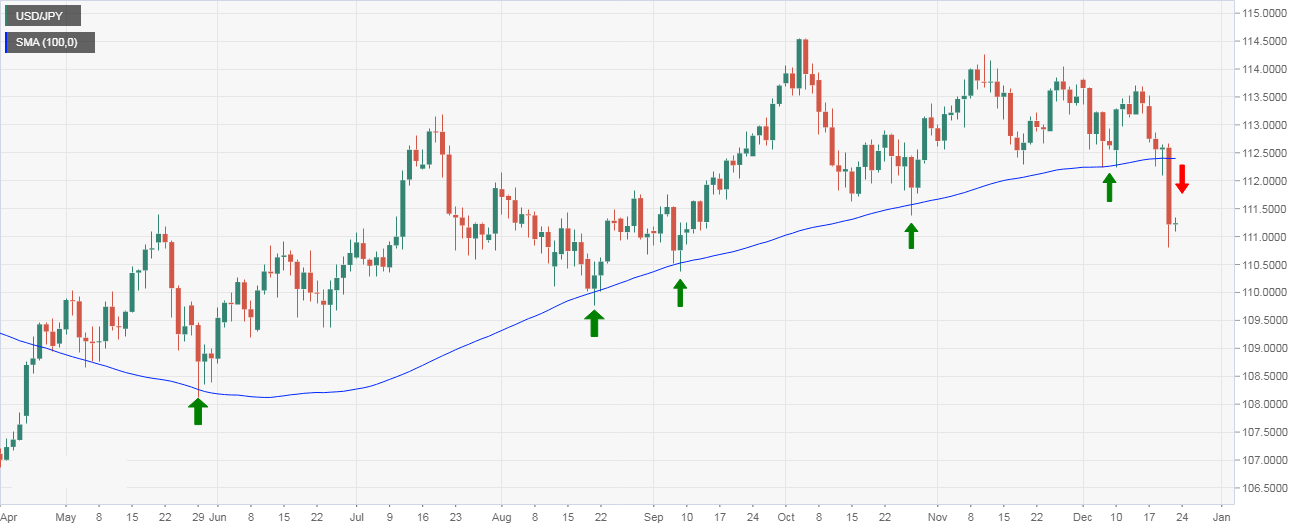
Trend: Bearish
USD/JPY
Overview:
Today Last Price: 111.25
Today Daily change: 3.0 pips
Today Daily change %: 0.0270%
Today Daily Open: 111.22
Trends:
Previous Daily SMA20: 113.09
Previous Daily SMA50: 112.97
Previous Daily SMA100: 112.4
Previous Daily SMA200: 110.88
Levels:
Previous Daily High: 112.67
Previous Daily Low: 110.81
Previous Weekly High: 113.71
Previous Weekly Low: 112.24
Previous Monthly High: 114.25
Previous Monthly Low: 112.3
Previous Daily Fibonacci 38.2%: 111.52
Previous Daily Fibonacci 61.8%: 111.96
Previous Daily Pivot Point S1: 110.46
Previous Daily Pivot Point S2: 109.71
Previous Daily Pivot Point S3: 108.6
Previous Daily Pivot Point R1: 112.32
Previous Daily Pivot Point R2: 113.43
Previous Daily Pivot Point R3: 114.18
