- USD/JPY main bull trend is in correction mode since July 19.
- USD/JPY is finding resistance at the 110.40 supply/demand level, the 200-period simple moving average and the bearish trendline from August 15. Targets are the 109.91-97 area and the 109.37 June 25 swing low.
- A bull breakout above 110.58 would negate the bearish bias.
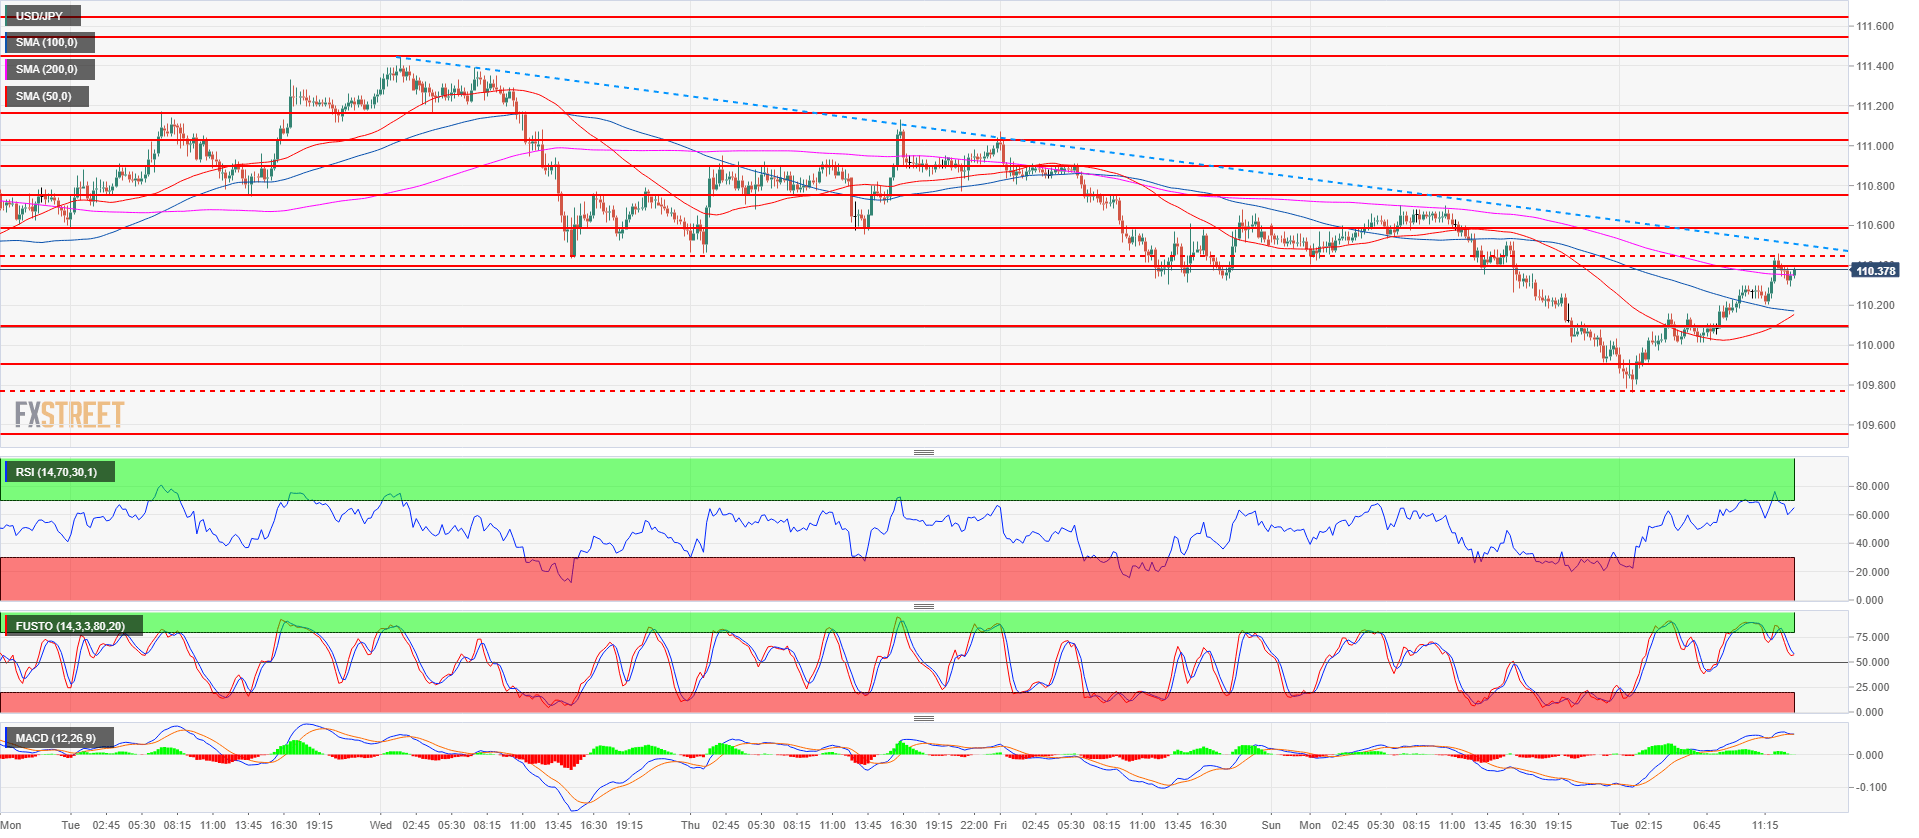
Spot rate: 110.37
Relative change: 0.28%
High: 110.46
Low: 109.76
Main trend: Bullish
Short-term trend Bearish below 110.58
Resistance 1: 110.40 supply/demand level
Resistance 2: 110.58 July 26 swing low
Resistance 3: 110.75, July 23 low
Support 1: 110.10 August 13 swing low
Support 2: 109.91-97 area, 200 and 100-day simple moving average
Support 3: 109.37 June 25 swing low
Support 4: 109.19 June 8 low
