- USD/JPY is under selling pressure at multi-month lows.
- The level to beat for bears is the 105.00 figure.
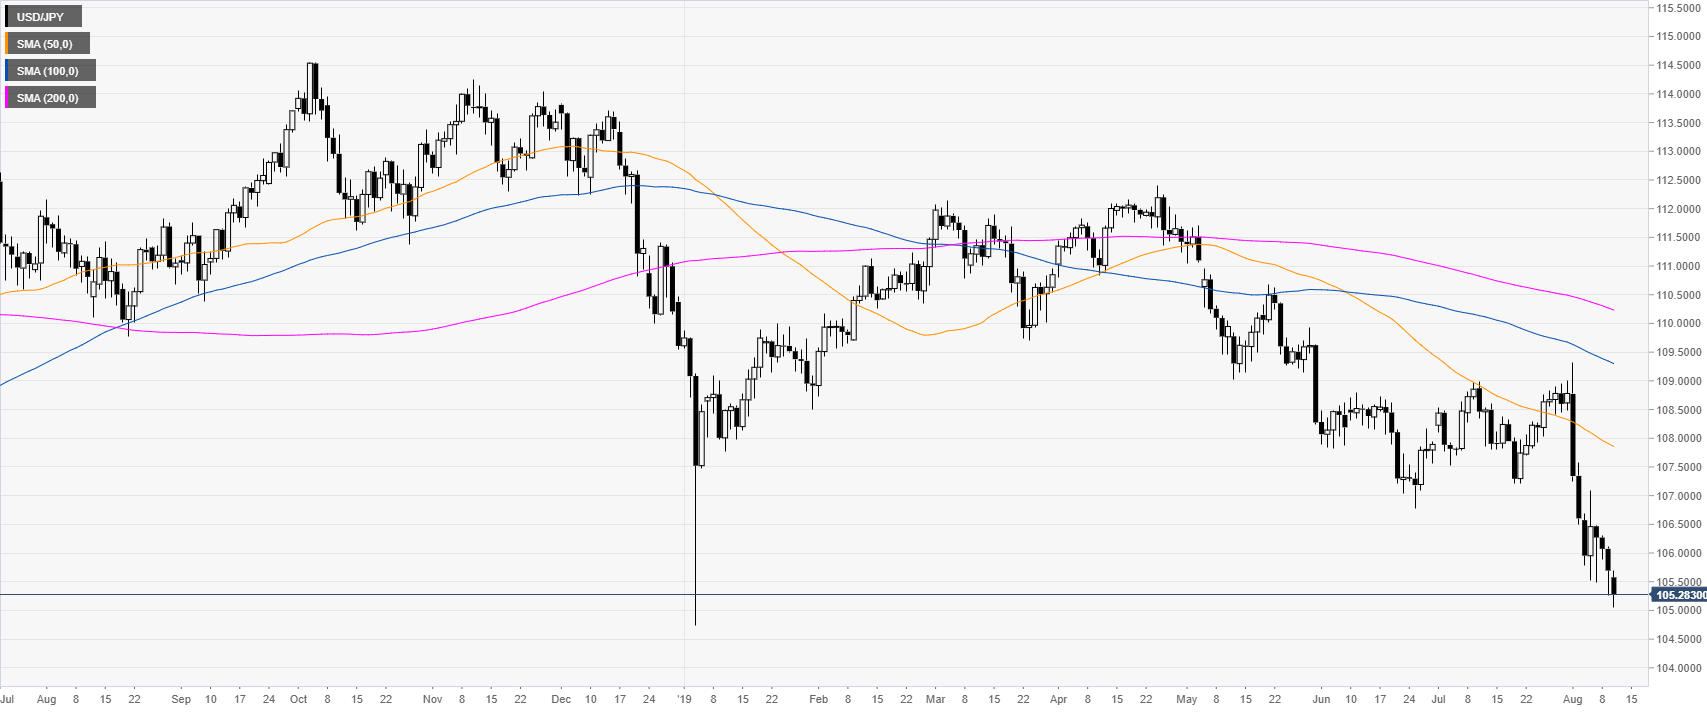
USD/JPY daily chart
USD/JPY is trading near multi-month lows while below its main daily simple moving averages (DSMAs). Trade war news are driving USD/JPY price action.
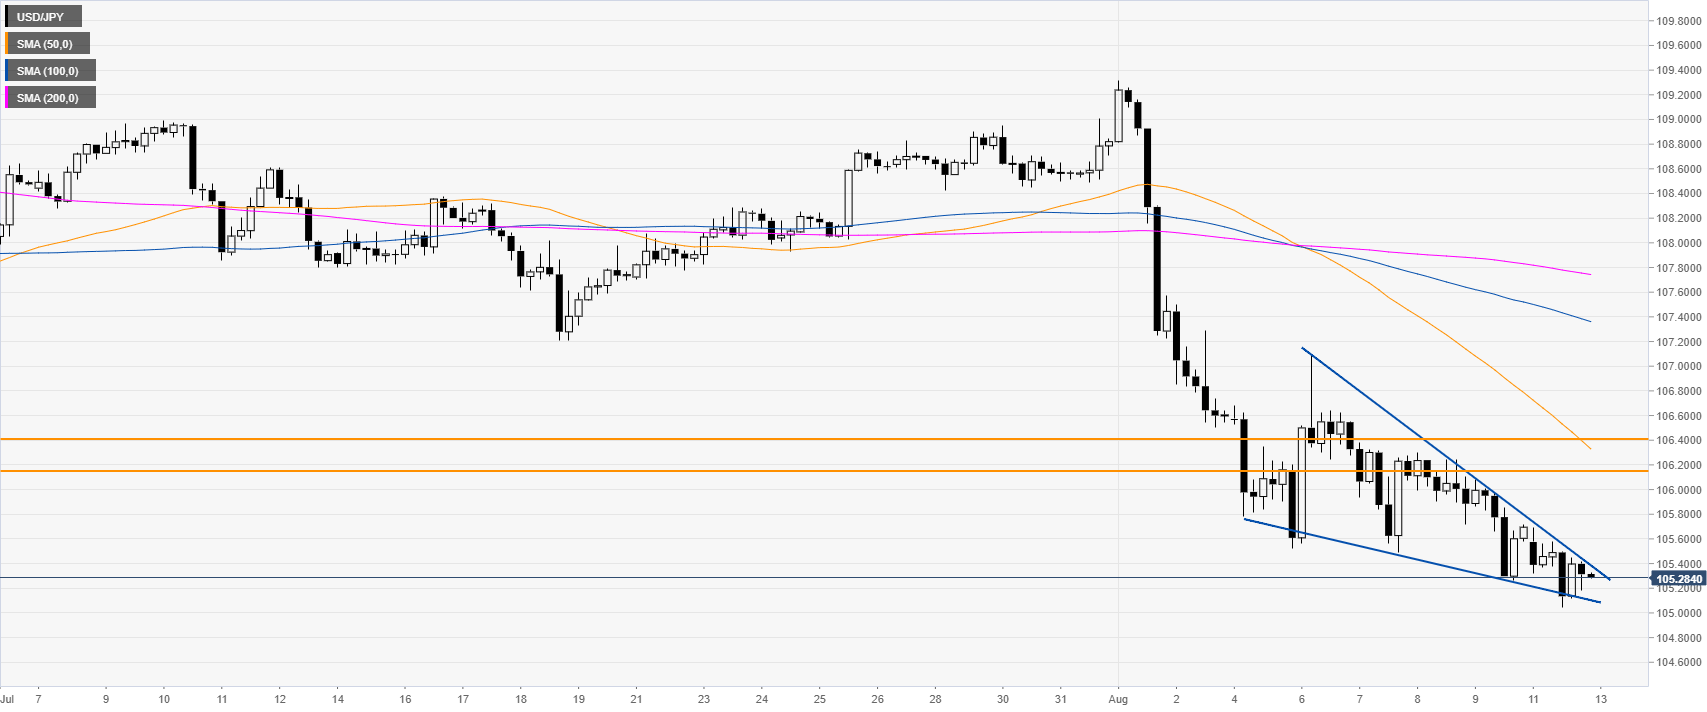
USD/JPY 4-hour chart
USD/JPY is trading below its main SMAs, suggesting bearish momentum. However, the bullish wedge might alleviate the bearish pressure in the medium term. There is a lot of resistance and it won’t be easy for bulls. The main resistance is at 106.14 followed by 106.40, according to the Technical Confluences Indicator.
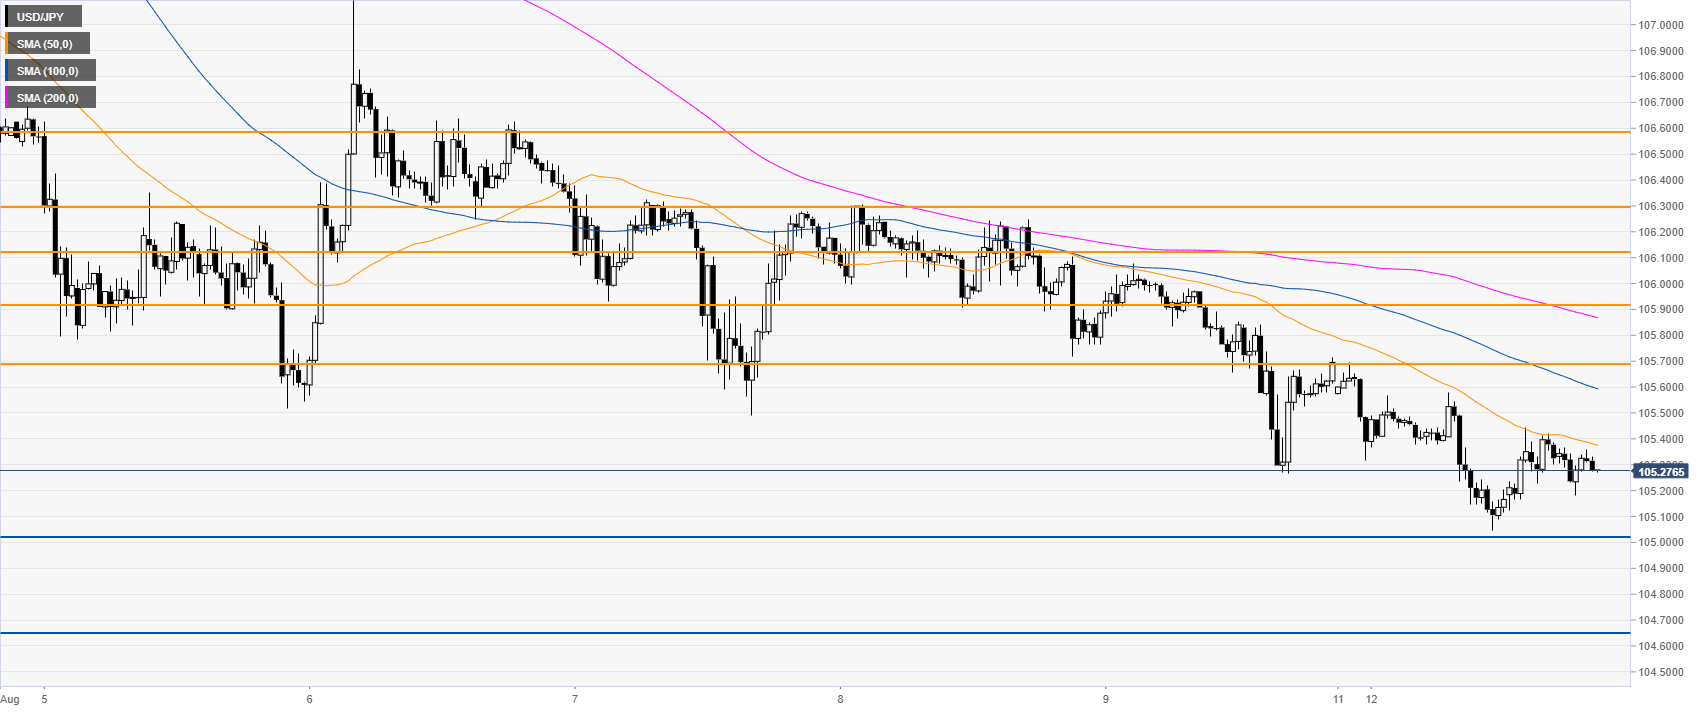
USD/JPY 30-minute chart
The market is trading below its main SMAs, suggesting bearish momentum. A break below 105.00 can lead to an extension of the bear trend towards the 104.65 and 104.20 levels,
Additional key levels
