- USD/JPY rises to nearly two weeks high while confronting the key upside barrier.
- 50% Fibonacci retracement, 200-day SMA follow the breakout.
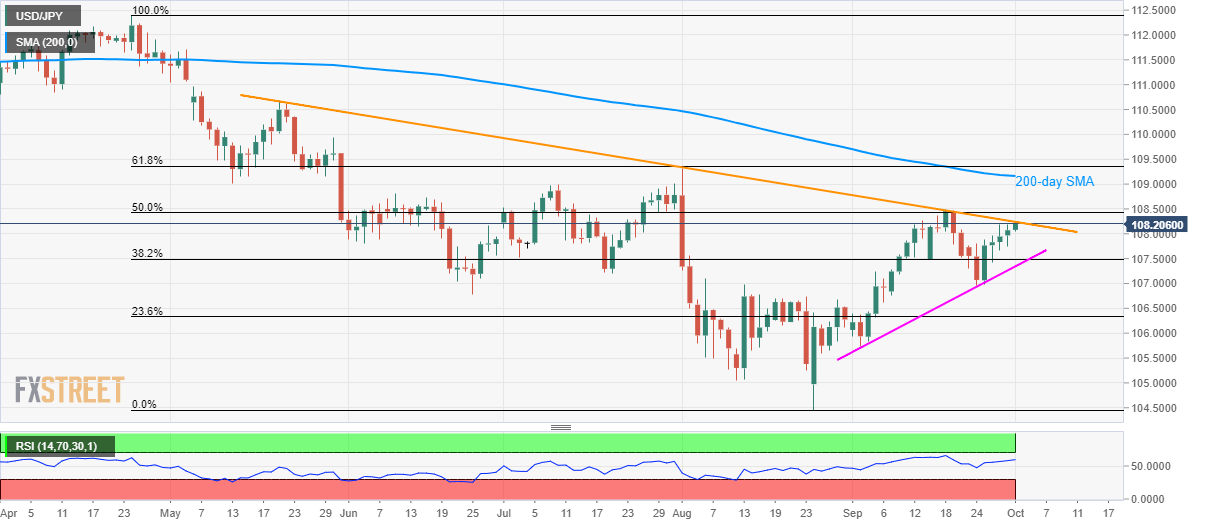
- Four-week-long rising trend-line limit near-term declines.
While taking bids to 108.22, USD/JPY trades near the highest in nearly two weeks on early Tuesday. The pair now confronts a downward-sloping trend-line stretched since May 21.
Given the upbeat conditions of 14-bar relative strength index (RSI), coupled with the overall strength of the US Dollar (USD), the pair is likely to surpass 108.25/30 resistance.
In doing so, 50% Fibonacci retracement level of April-August declines, at 108.42, could become buyers’ next choice whereas 200-day simple moving average (SMA) level of 109.20 and 61.8% Fibonacci retracement level near 109.40 could entertain them afterward.
On the flip side, 38.2% Fibonacci retracement and a four-week-old rising trend-line, around 107.50 and 107.35 respectively, could limit pair’s pullback.
Should there be increased selling pressure below 107.35, 106.80/70 area has multiple supports to question bears.
USD/JPY daily chart
Trend: bullish
