- The safe-haven demand for the Japanese Yen is somewhat decreasing as the global risk sentiment has momentarily stopped worsening.
- USD/JPY is starting the week sidelined between the 109.30 and 109.60 levels.
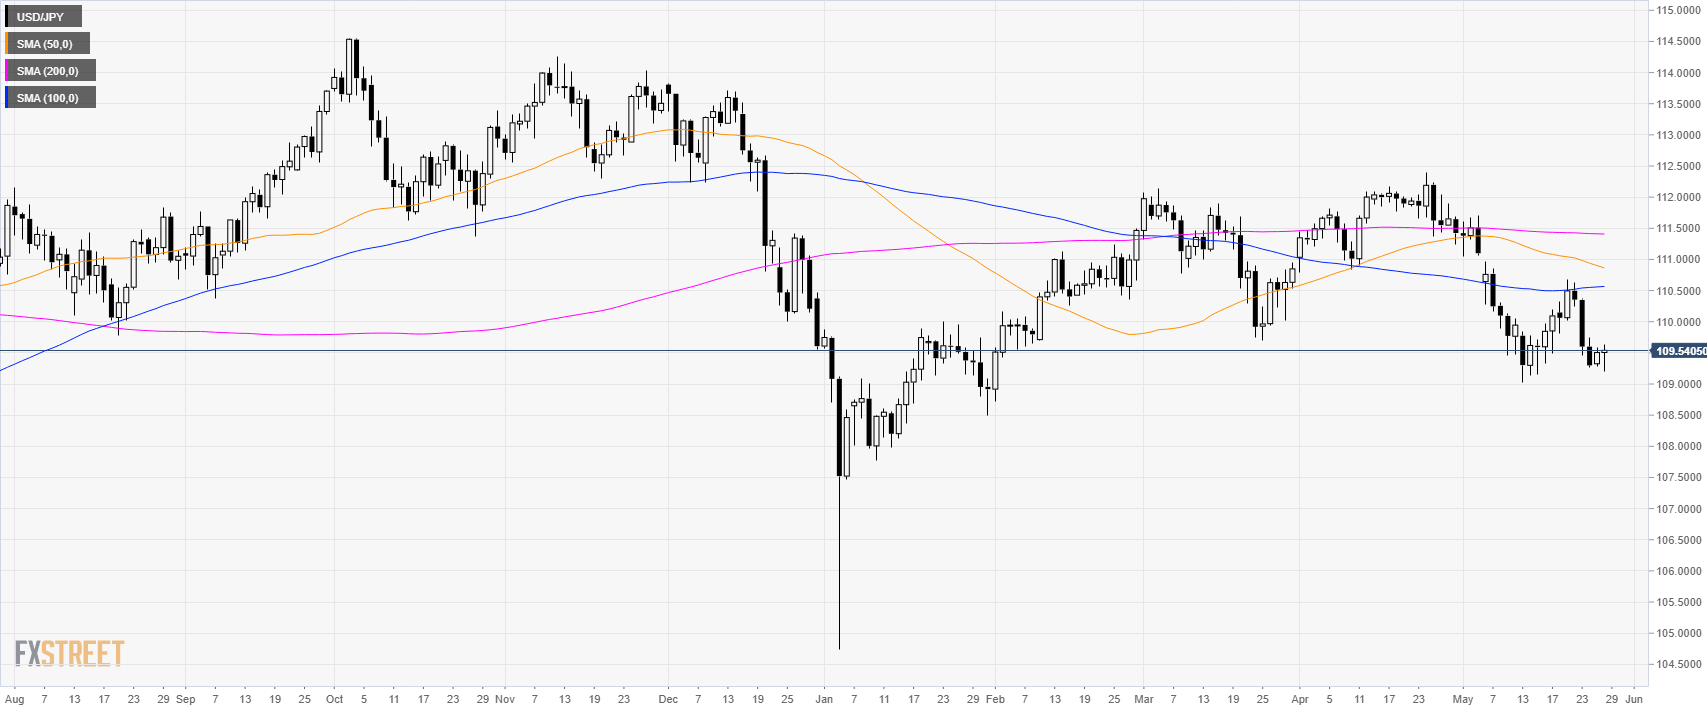
USD/JPY daily chart
USD/JPY is currently at multi-month lows trading below its main simple moving averages (SMAs).
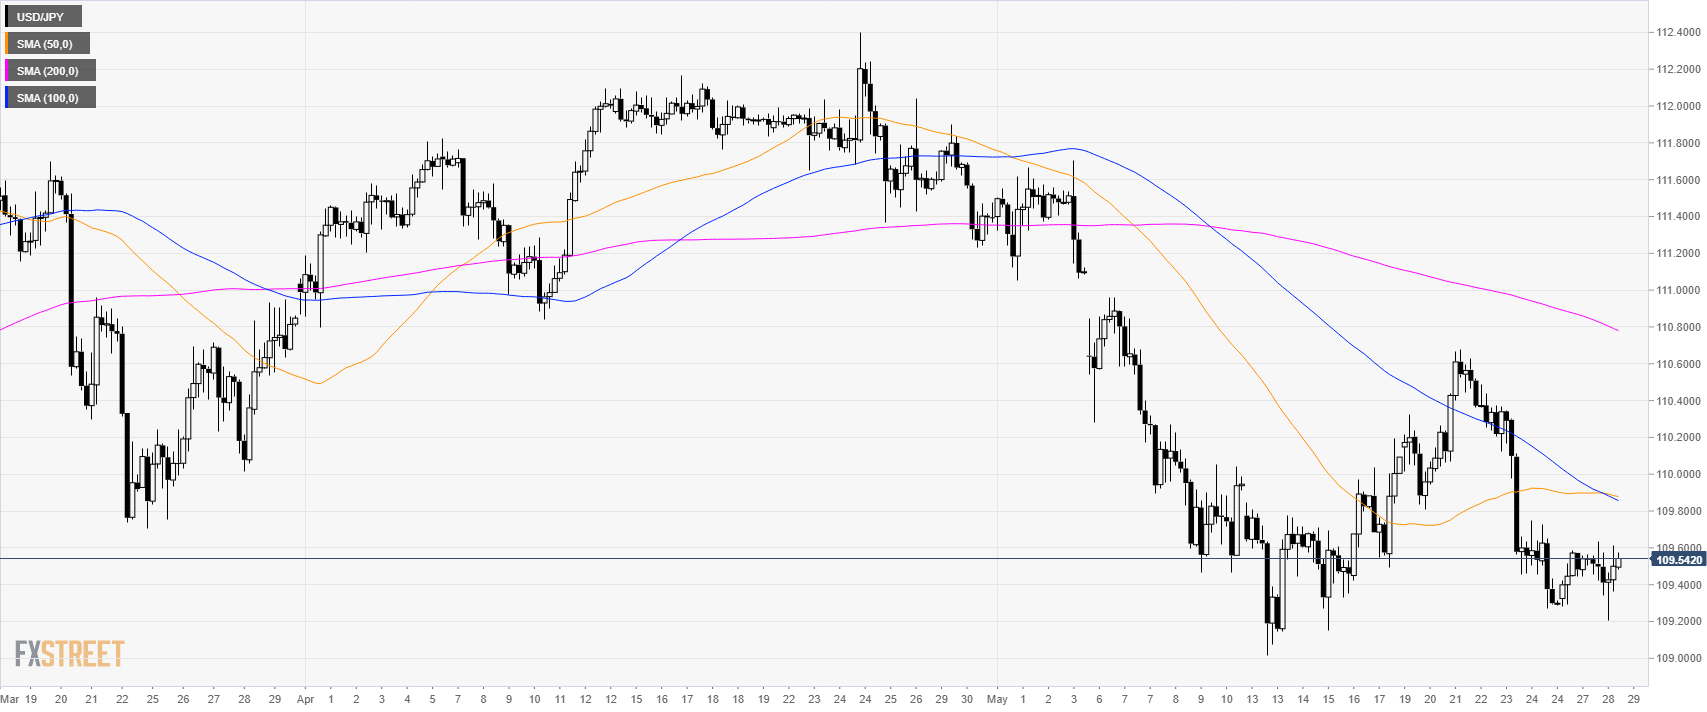
USD/JPY 4-hour chart
USD/JPY is trading below its main SMAs suggesting a bearish bias in the medium term.
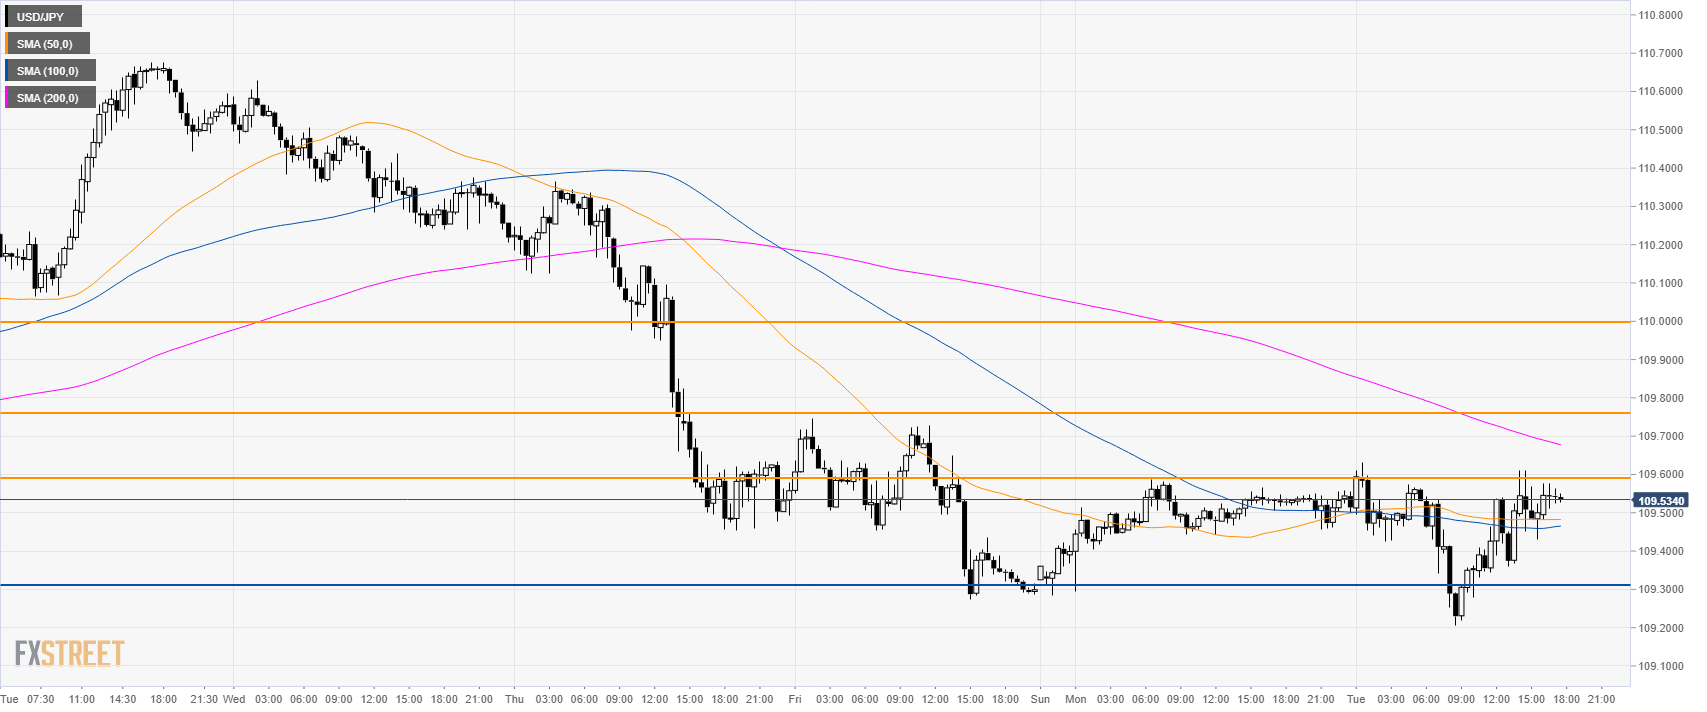
USD/JPY 30-minute chart
USD/JPY is trading in a range between the 109.30 support and the 109.75 resistance. USD bulls will need to drive the market above 109.60 and 109.75 resistances. If they succeed then 110.00 can be next. Alternatively, if the bears have a daily close below 109.30 and 109.00 the figure then traders can expect further weakness twoards 108.00 the figure.
Additional key levels
